Introducing the Web Vitals Chrome Extension
May 29, 2020

The new Web Vitals Chrome extension measures metrics for a healthy user-experience on the web. It’s now available to install from the Chrome Web Store.
Chrome’s Web Vitals initiative provides unified guidance about quality signals that are essential for all sites to deliver a great user experience. These signals include:

The extension supports all of the Core Web Vitals and leverages the web-vitals library under the hood. The extension measures metrics in a way that matches how they’re measured by Chrome and reported to other Google tools (e.g. Chrome User Experience Report, Page Speed Insights, Search Console).
Usage
Ambient badge

The Ambient Badge helps check if a page passing the Core Web Vitals thresholds.
Once installed, the extension will display a disabled state badge icon until you navigate to a URL. At this point it will update the badge to green or red depending on whether the URL passes the Core Web Vitals metrics thresholds.
The badge has a number of states:
- Disabled - gray
- Passing - green
- One or more metrics failing - red
If one or more metrics are failing, the badge will animate the values of these metrics.
Detailed drill-down

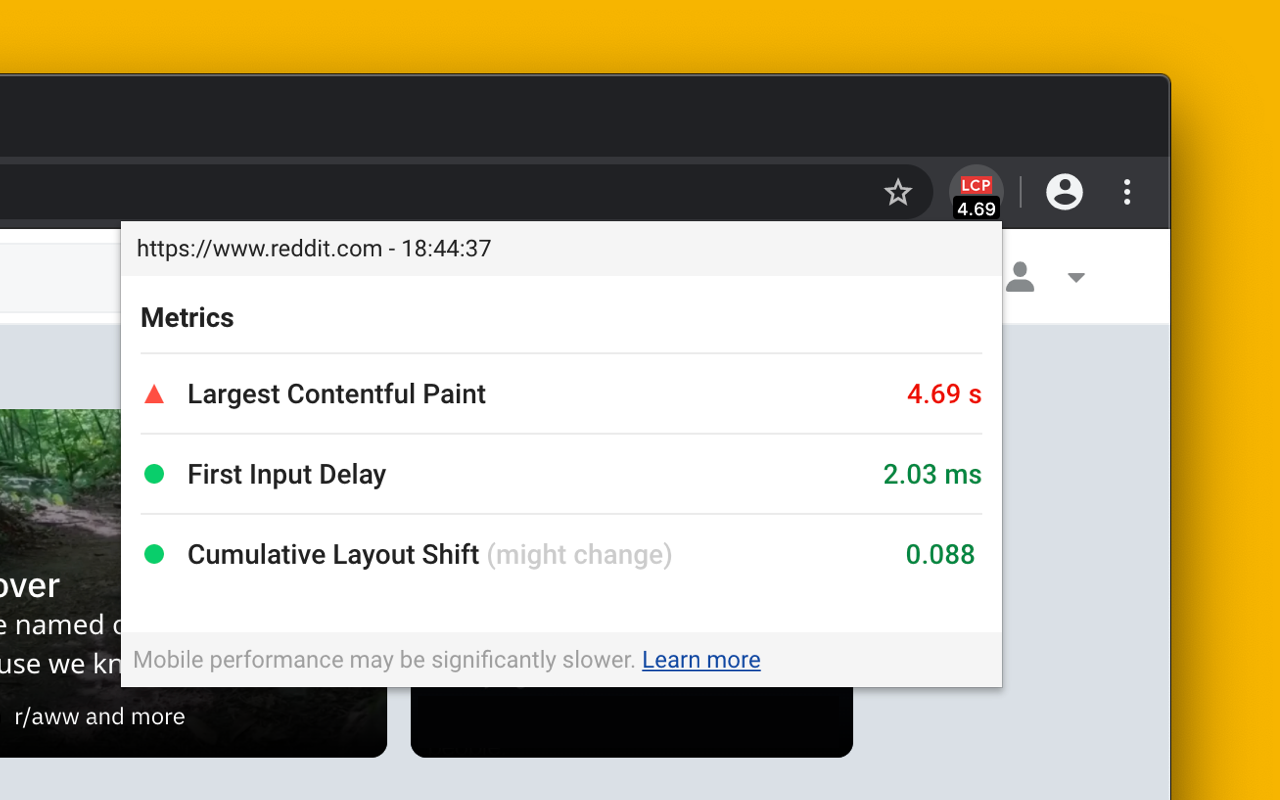
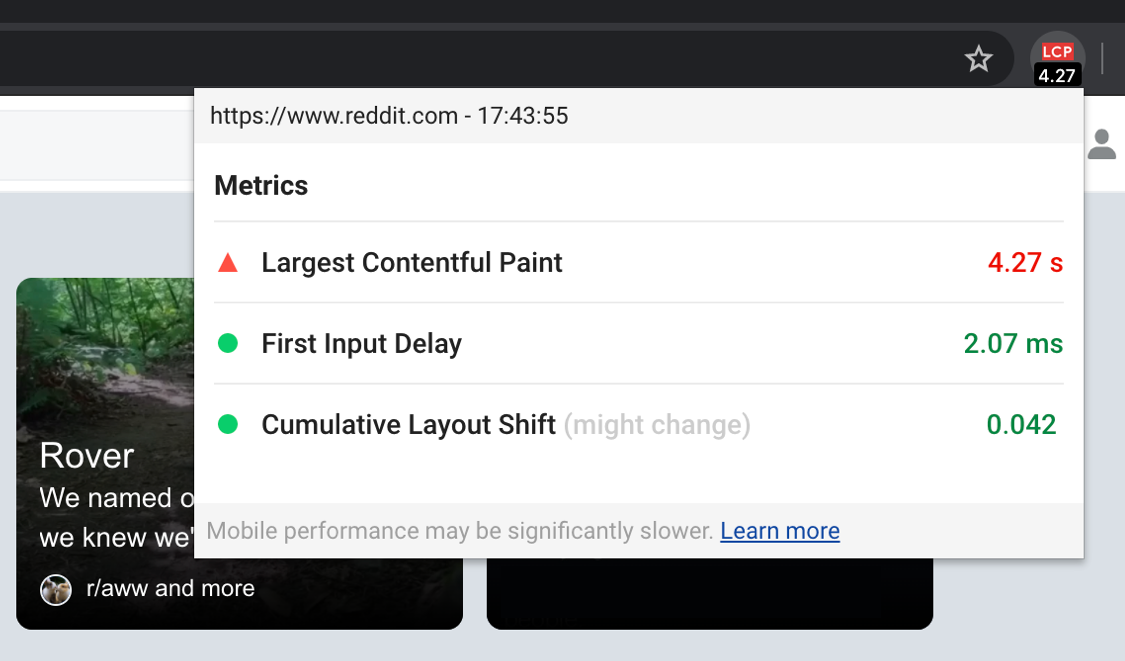
Clicking the Ambient badge icon will allow you to drill in to the individual metric values. In this mode, the extension will also say if a metric value might change or requires a user action.
For example, First Input Delay requires a real interaction (e.g click/tap) with the page and will be in a waiting for input state until this is the case. We recommend consulting the web.dev documentation for LCP, CLS and FID to get an understanding of when metric values settle.
In a future release, the drill-down will also include aggregate field performance data from PageSpeed Insights and the Chrome User Experience Report.
Overlay

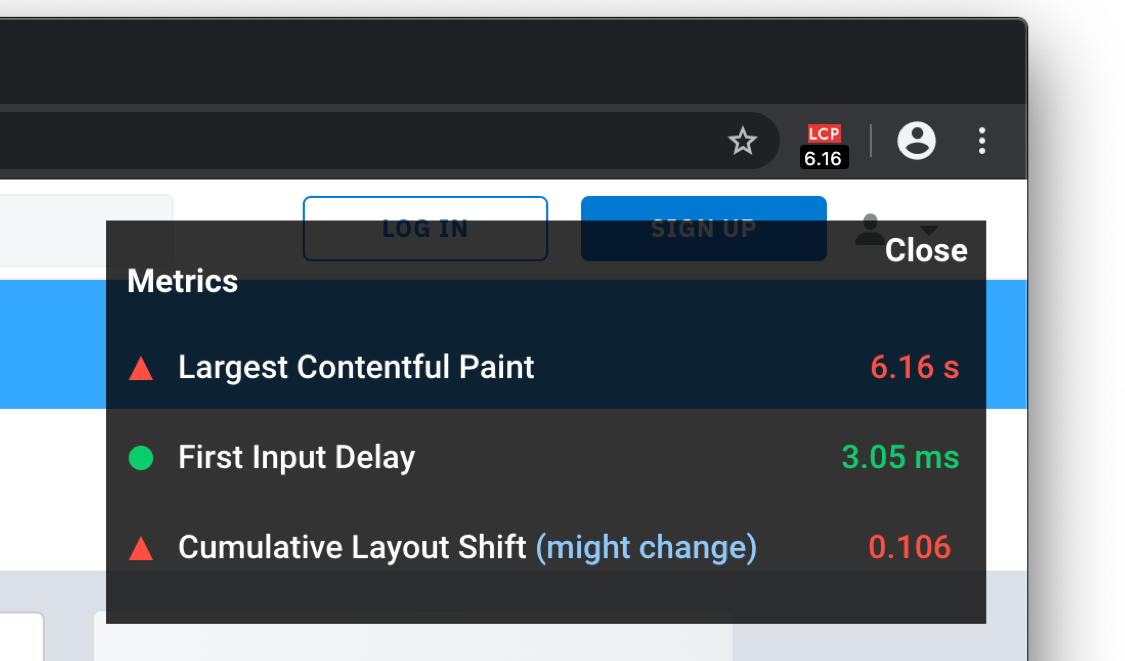
The overlay displays a Heads up display (HUD) which overlays your page. It is useful if you need a persistent view of your Core Web Vitals metrics during development. To enable the overlay:
- Right-click on the Ambient badge and go to Options.
- Check
Display HUD overlayand click ‘Save’ - Reload the tab for the URL you wish to test. The overlay should now be present.
FAQ
Who is the primary audience for this extension?
The primary audience for this extension is developers who would like instant feedback on how their pages are doing on the Core Web Vitals metrics during development on a desktop machine.
How should I interpret the metrics numbers reported by this tool?
This extension reports metrics for your desktop or laptop machine. In many cases this hardware will be significantly faster than that of the median mobile phone your users may have. For this reason, it is strongly recommended that you test using tools like Lighthouse and on real mobile hardware (e.g via WebPageTest) to ensure all your users there have a positive experience.
What actions can I take to improve my Core Web Vitals?
We are making available a set of guides for optimizing each of the Core Web Vitals metrics if you find your page is not passing a particular threshold:
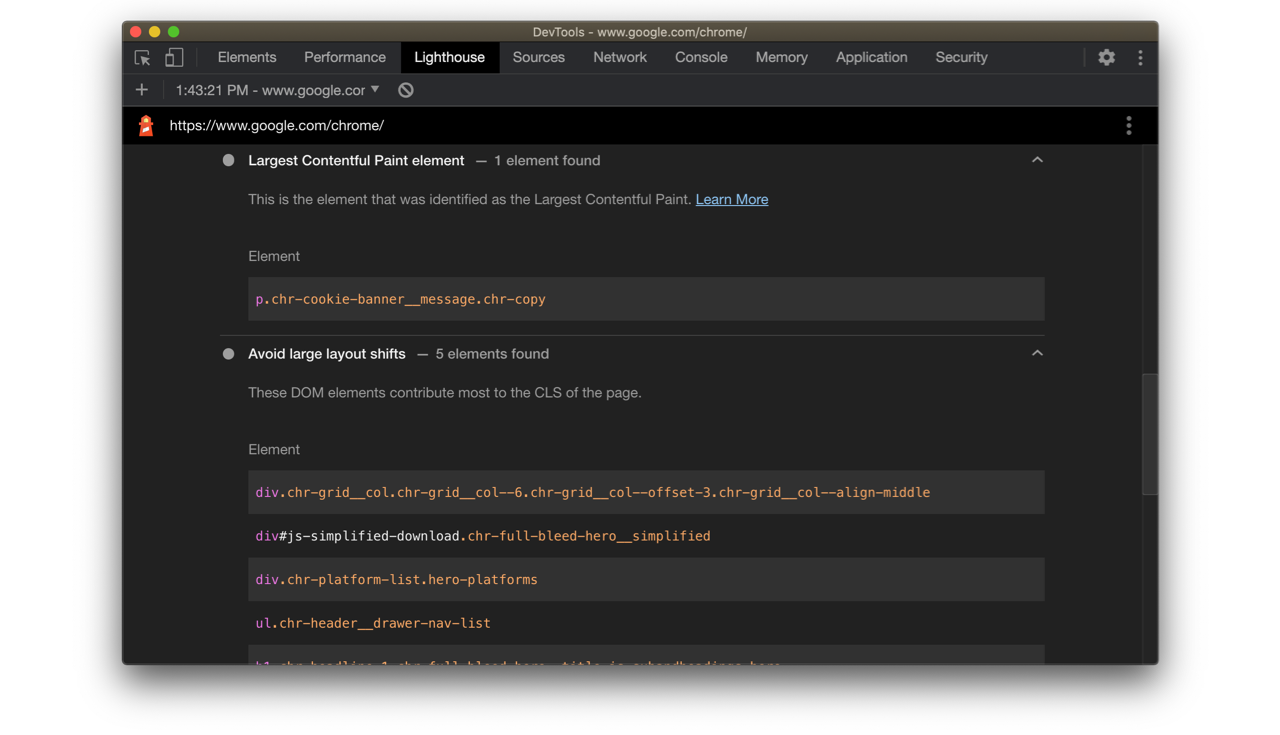
Lighthouse 6.0 also includes additional actionability audits for these metrics. It answers questions like:
- What element was identified as the Largest Contentful Paint?
- What elements experienced a shift and contributed to Cumulative Layout Shift?

We envision users will use the extension for instant feedback on metrics (for their desktop machine) but will then go and do a Lighthouse audit for (1) a diagnostic view of how these metrics look on a median mobile device and (2) specifically what you can do to improve.