Taming The Unicorn: Easing JavaScript Memory Profiling In Chrome DevTools
April 11, 2013

“The Unicorn has a special ability to help it's master when in trouble. When tamed, they will not attack humans or tamed creatures, but will attack anything else with negative karma"
The DevTools Heap Profiler and Timeline Memory view can be used to diagnose memory leaks on both desktop and mobile (via remote debugging). When you first use them however, they can feel like a little like a black box, requiring some trial and error to correctly master.
In this article, I’ll walk you through how to tame these tools with answers to some common FAQs to help save you time when memory profiling your apps.
Understanding the Unicorn
A garbage collector (such as the one in V8) needs to be able to locate objects in your application which are live as well as those which are considered dead (garbage) and cannot be reached. If garbage collection (GC) misses dead objects due to logical errors in your JavaScript, memory consumed by these objects can’t be reclaimed and can end up making your application slow over time.
This often happens when you’ve written your code in such a way that variables and event listeners you don’t require for long are still referenced by some code that no longer has a need to keep those references and thus they can’t be correctly cleaned up by GC.
Remember to check and nullify variables that contain references to DOM elements which may be getting updated/destroyed during the lifecycle of your app. Check object properties which may reference other objects (or other DOM elements). Be sure to keep an eye on variable caches which may accumulate over time.
Q: I’ve been told to use the Heap Profiler and Timeline Memory view for detecting memory leaks. What tool should be used first?
The Timeline. Use it to diagnose excessive memory usage when you first notice your page has slowed down after extended use. Slowdown was once a classic symptom of a memory leak but it could also be something else - maybe you have a paint or network bottleneck in your page, so make sure to fix the real issue in your page.
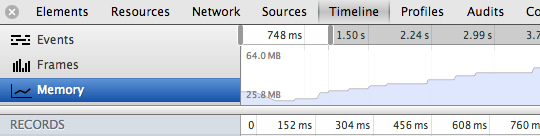
To diagnose whether memory is the issue, go to the Timeline panel and Memory view. Hit the record button and interact with your application, repeating any steps you feel may be causing a leak. Stop the recording. The graph you see will display the memory allocated to your application. If it happens to be consuming an increasing amount of this over time (without ever dropping), it’s an indication you may have a memory leak.
The profile for a healthy application should look more like a sawtooth curve as memory is allocated then freed when the garbage collector comes in. There’s nothing to worry about here - there’s always going to be a cost of doing business in JavaScript an even an empty requestAnimationFrame will cause this type of sawtooth, you can’t avoid it. Just ensure it’s not sharp as that’s an indication a lot of allocations are being made, which can equate to a lot of garbage on the other side.
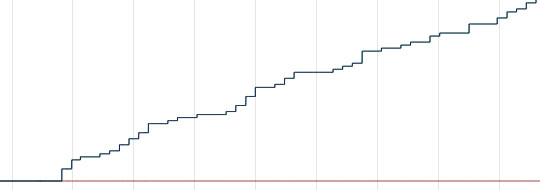
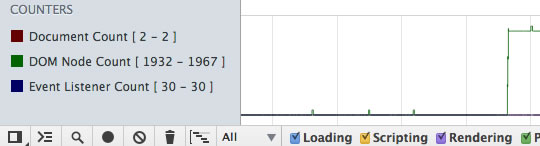
It's the rate of increase in the steepness of this curve that you need to keep an eye on.There is also a DOM node counter, Document counter and Event listener count in the Memory view which can be useful during diagnosis. DOM nodes use native memory and do not directly affect the JavaScript memory graph.
Once you suspect you have a memory leak, the Heap profiler can be used to discover the source of the leak.
Q: What workflow do you use for diagnosing memory leaks in the Heap Profiler?
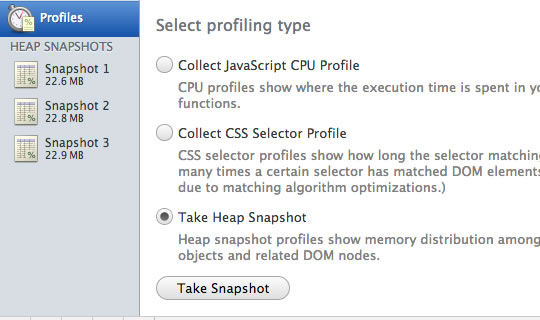
Diagnosing issues with memory can be tricky, but the best place to start is the Heap profiler's Summary view. Go to Profiles and take a heap snapshot before an intensive part of your code kicks in and then one more after this code has been allowed to run for a while. Repeat. You can then compare the snapshots using the Summary (and other) views to confirm what allocations have been made along with their impact on memory.
A good workflow for this is the "three snapshot" technique, first used by Loreena Lee and the GMail team to solve some of their memory problems. The steps for this are:
- Open the DevTools > Profiles
- Take a heap snapshot
- Perform an action in your app that you think is causing leaks
- Take a heap snapshot
- Repeat the same stuff once more
- Take a final heap snapshot
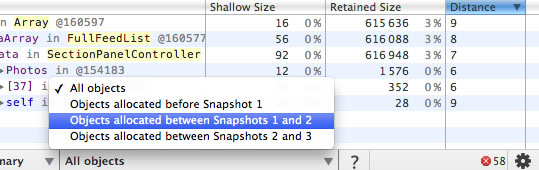
- Select the most recent snapshot taken
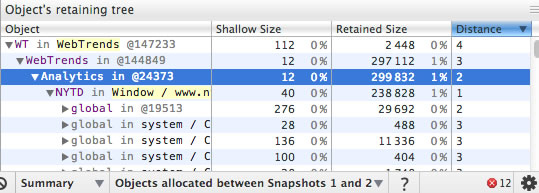
- At the bottom of the window, find the drop-down that says "All objects" and switch this to "Objects allocated between snapshots 1 and 2". (You can also do the same for 2 and 3 if needed)
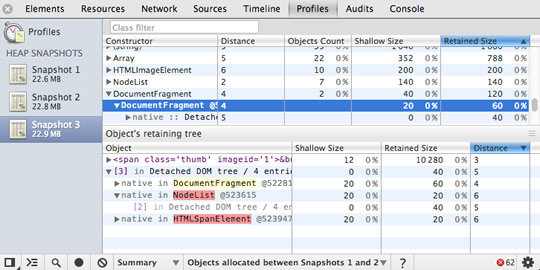
- In the view you'll see a list of leaked objects that are still hanging around. You can select one to see what is being retained in its retaining tree.
To fix, you'll want to find where in your code you're still retaining these references and properly dispose of them. If there are no leaks the Summary view should be empty.
Note: it sometimes makes sense to do a warm-up action before taking the first heap snapshot as there are cases where you might be doing lazy initialization for global variables on the first invocation. This is mostly a pro-tip for advanced use-cases, but leaving it here in case it is of help.
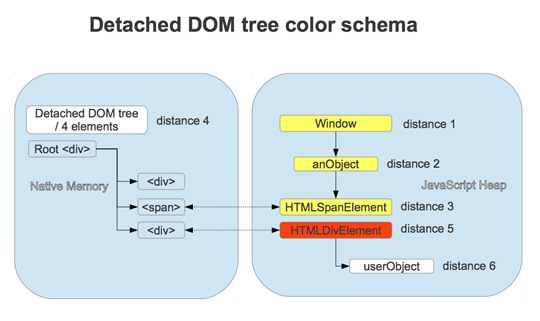
Q: I noticed a number of DOM nodes in the heap snapshot where some are highlighted in red and indicated as a "Detached DOM tree" whilst others are yellow. What does this mean?
You'll notice nodes of a few different colors. Red nodes do not have direct references from JavaScript to them, but are alive because they’re part of a detached DOM tree. There may be a node in the tree referenced from JavaScript (maybe as a closure or variable) but is coincidentally preventing the entire DOM tree from being garbage collected.
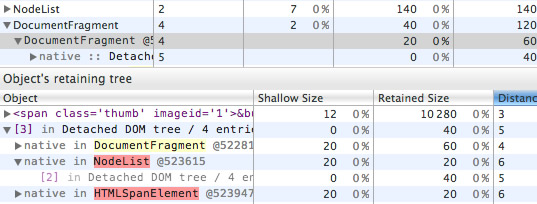
Yellow nodes however do have direct references from JavaScript. Look for yellow nodes in the same detached DOM tree to locate references from your JavaScript. There should be a chain of properties leading from the DOM window to the element (e.g window.foo.bar[2].baz).
Q: What do the Shallow and Retained Size columns represent and what are the differences between them?
So, objects can be kept in memory (be alive) in two different ways – either directly by another alive object (window and document are always alive objects) or implicitly by holding references from native part of the renderer (like DOM objects). The latter is what ends up preventing these objects from being disposed by GC automatically, causing leaks. The size of memory held by an object itself is known as the shallow size (generally, arrays and strings have larger shallow sizes).
An object of any size can hold a ton of memory if it prevents other objects from being disposed. The size of memory that can be freed once an object is deleted (and this its dependents made no longer reachable) is called the retained size.
Q: There's a lot of data in the constructor and retained views. Where should I start digging into to discover if I have a leak?
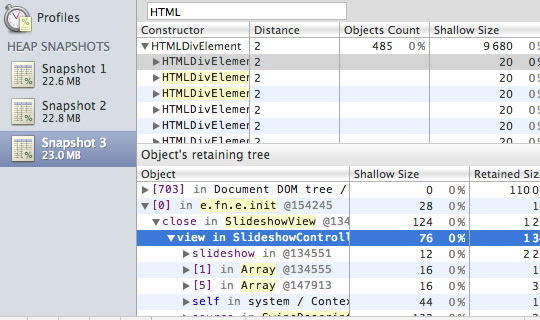
It's generally a good idea to begin investigation from the first object retained in your tree as retainers are sorted by distance (well, distance to the window).
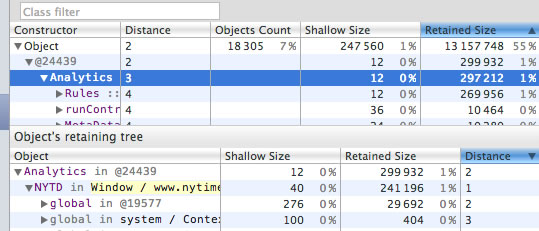
The object retained with the shortest distance is usually your first candidate for causing a memory leak.
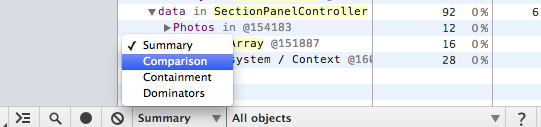
Q: What's the difference between the different Summary, Comparison, Dominators and Containment views?
You may get some mileage by switching between the different data views available at the bottom of the screen.
-
Summary view helps you hunt down objects (and their memory use) based on type grouped by constructor name. This view is particularly helpful for tracking down DOM leaks.
-
Comparison view helps you track down memory leaks, by displaying which objects have been correctly cleaned up by the garbage collector. Generally used to record and compare two (or more) memory snapshots of before and after an operation. The idea is that inspecting the delta in freed memory and reference count lets you confirm the presence and cause of a memory leak.
-
Containment view provides a better view of object structure, helping us analyse objects referenced in the global namespace (i.e. window) to find out what is keeping them around. It lets you analyse closures and dive into your objects at a low level.
-
Dominators view helps confirm that no unexpected references to objects are still hanging around (i.e that they are well contained) and that deletion/garbage collection is actually working.
Q: What do the various constructor (group) entries in the Heap profiler correspond to?
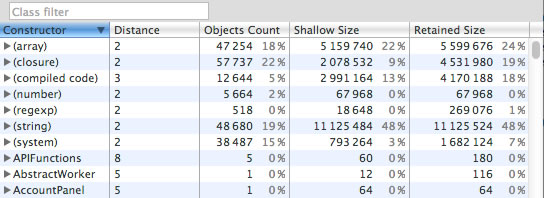
- (global property) - intermediate objects between a global object (like 'window') and an object referenced by it. If an object is created using a constructor Person and is held by a global object, the retaining path would look like [global] > (global property) > Person. This contrasts with the norm, where objects directly reference each other. We have intermediate objects for performance reasons. Globals are modified regularly and property access optimisations do a good job for non-global objects aren't applicable for globals.
- (roots) - The root entries in the retaining tree view are the entities that have references to the selected object. These can also be references created by the engine for its own purposes. The engine has caches which reference objects, but all such references are weak and won't prevent an object from being collected given that there are no truly strong references.
- (closure) - a count of references to a group of objects through function closures
- (array, string, number, regexp) - a list of object types with properties which reference an Array, String, Number or regular expression
- (compiled code) - simply, everything related to compiled code. Script is similar to a function but corresponds to a <script> body. SharedFunctionInfos (SFI) are objects standing between functions and compiled code. Functions are usually have a context, while SFIs do not.
- HTMLDivElement, HTMLAnchorElement, DocumentFragment etc - references to elements or document objects of a particular type referenced by your code.
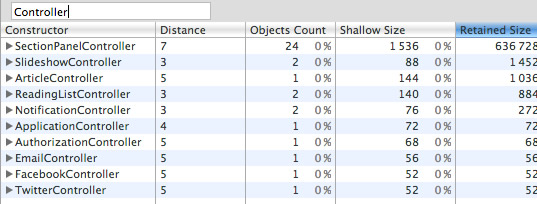
Many of the other objects you may see were likely generated during the lifecycle of your code and can include event listeners as well as custom objects, like the controllers below:
Q: Is there anything I should be turning off in Chrome that might be influencing my figures?
When performing any type of profiling using the Chrome DevTools, it is recommended that you either run in incognito mode with all extensions disabled or start Chrome with a custom user data directory (--user-data-dir=”…”).

Apps, extensions and even console logging can have an implicit impact on your figures and you want to keep them as reliable as possible.
Closing remarks
If the rider becomes poisoned and their health drops below a certain point, the Unicorn will attempt to cast cure on them using it's magery skill.
The JavaScript engines of today are highly capable of automatically cleaning garbage generated by our code in a number of situations. That said, they can only go so far and our applications are still prone to memory leaks caused by logical errors.
The Heap profiler (and Timeline) can help diagnose such issues and I hope this article has helped demystify a little of the power these tools are capable of. If you have any further questions about our profiling or timeline tools, feel free to let me know (or, better post it to the DevTools Google Group) and we'll do our best to get you an answer. Happy profiling!
PS: Don't forget to check out episode 8 of the Breakpoint where John and Loreena walk you through some memory profiling tips live.
My thanks to Paul Lewis and Ilya Tikhonovsky for reviewing this article.