Shine a light on JavaScript performance with Lighthouse
October 14, 2018
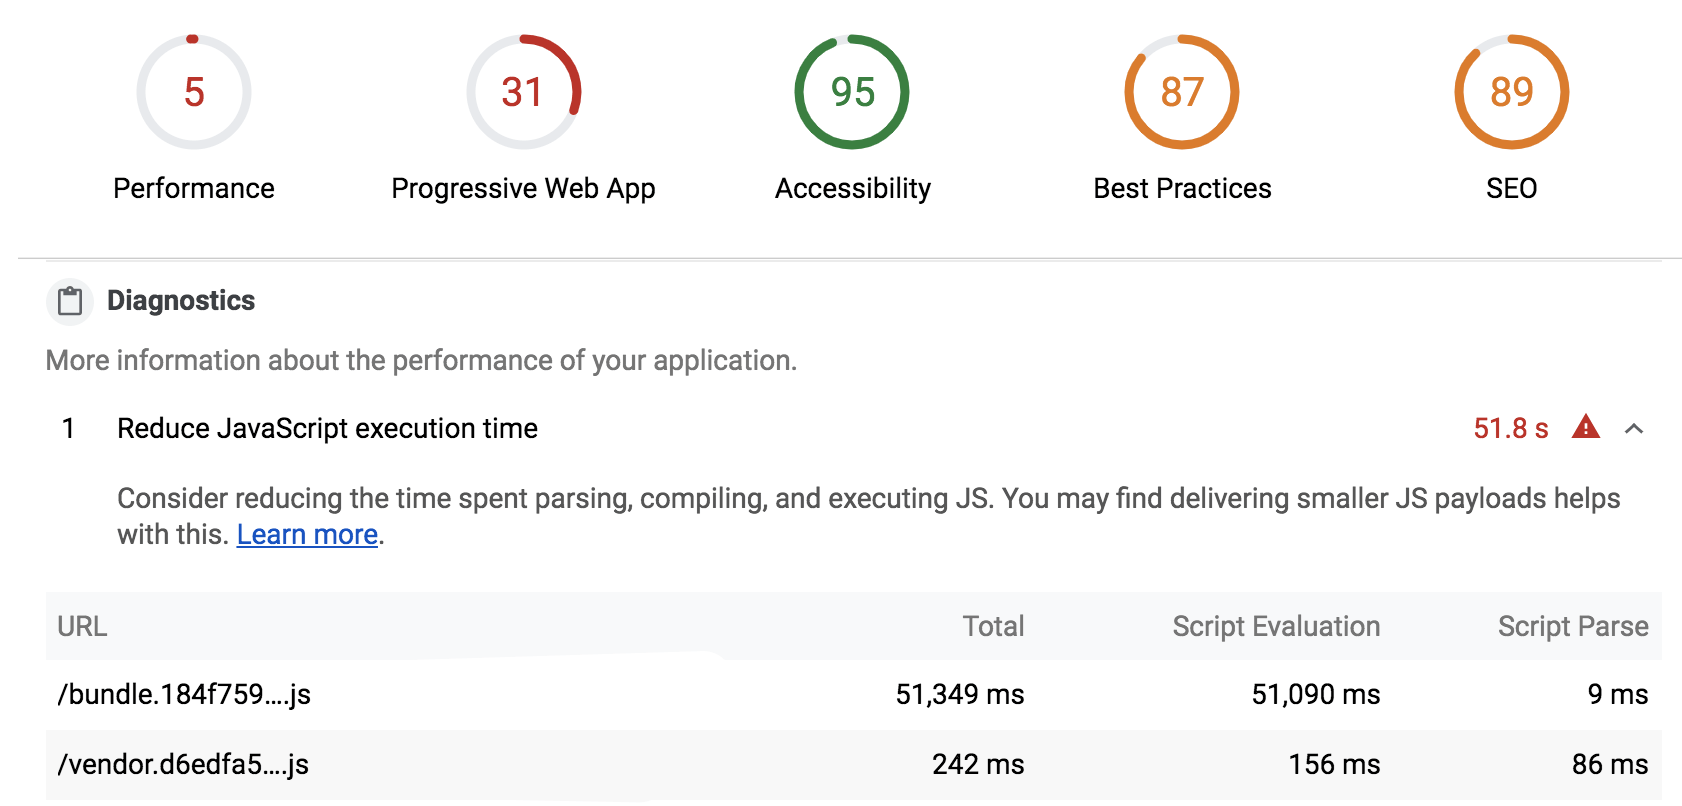
Unsure if the cost of JavaScript is too high for your user-experience? 🙃 Lighthouse has a JavaScript execution time audit that measures the total impact of JavaScript on your page’s load performance:
Try it. It’s in the Chrome DevTools Audits panel today. It’s also available via WebPageTest.
For the above content site, it takes 51s (oi vey) for the browser to process just the primary bundle for this site on mobile. Including network transfer time, a user could be waiting for up to a minute to interact with this page ⏳😪

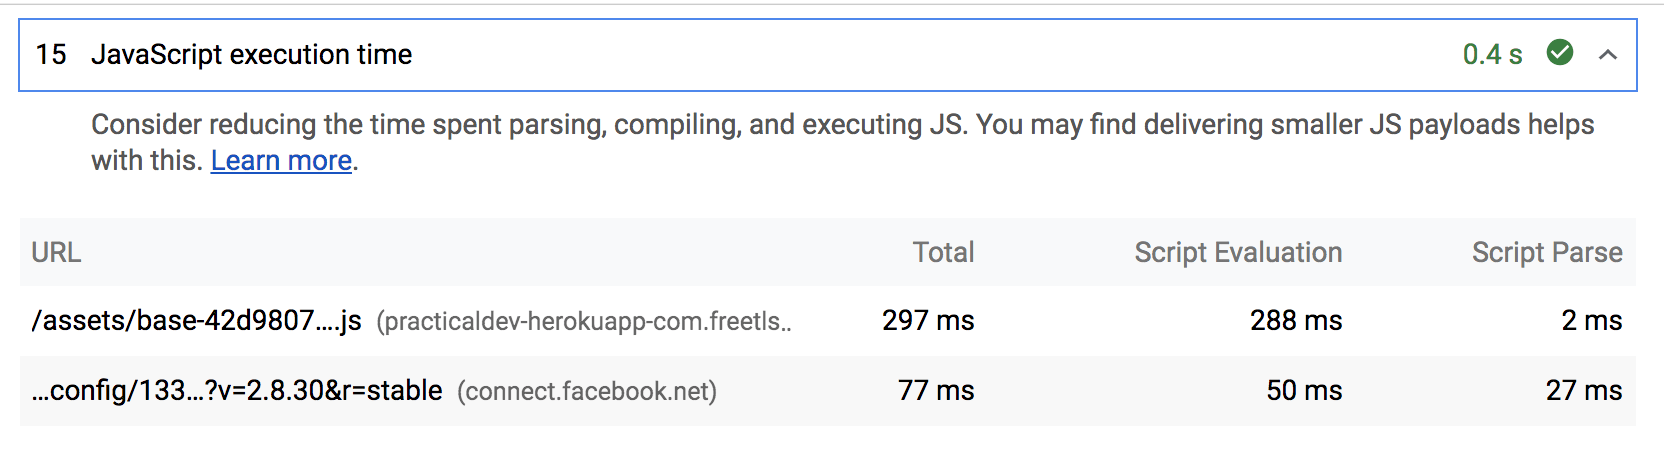
That’s time spent parsing, compiling and executing script on a median mobile device configuration. dev.to (offering a similar content experience) is able to load their main bundle with a minimal dependency on script execution ❤️
How can we improve the cost of JS in the original site?
By only shipping JavaScript the user really needs upfront. We can lazily load the rest as needed using techniques like code-splitting. I use the DevTools Code Coverage feature to help here.
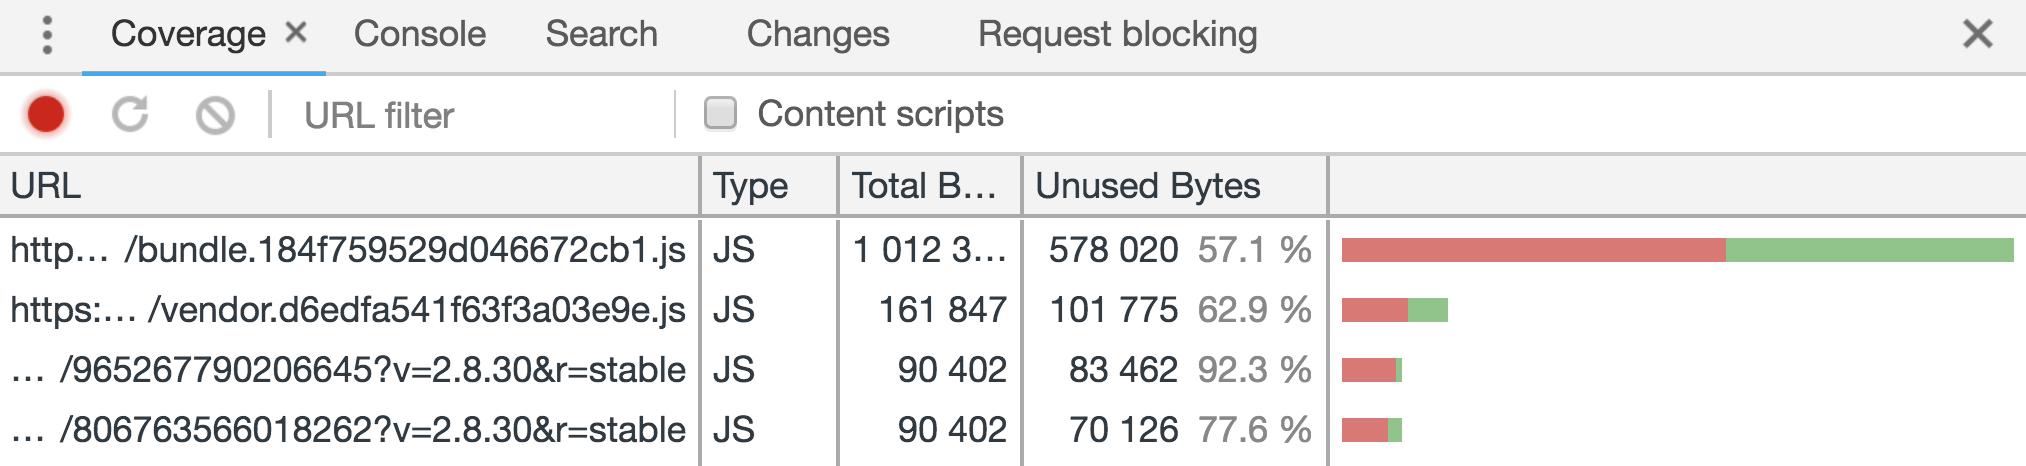
If I hit record and load up the above experience then interact for a while, we can see about 57% of the code loaded upfront may not be needed. That’s a great candidate for something that can be loaded on-demand.
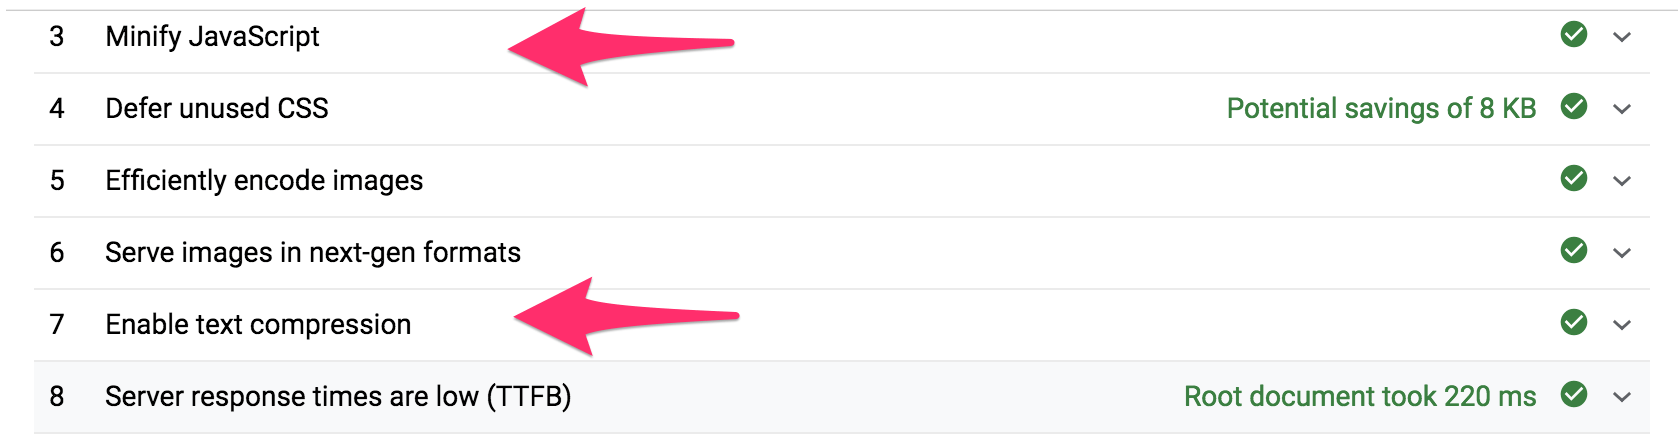
If you haven’t checked out Lighthouse before, it’s full of useful nuggets like checks for whether you’re correctly minifying your scripts or compressing them:
And if you’re into automation using headless Chrome, there’s also a useful code-coverage example for Puppeteer that can visualize JS code coverage usage across page loads.
Wrapping up.. 🎁
JavaScript can have a large impact on your user-experience; Lighthouse can highlight opportunities to improve here. To keep JavaScript transmission and processing times low:
- Only send the code that your users need.
- Minify and compress your scripts.
- Remove unused code and dependencies.