Web Performance Recipes With Puppeteer
April 28, 2020
Table Of Contents
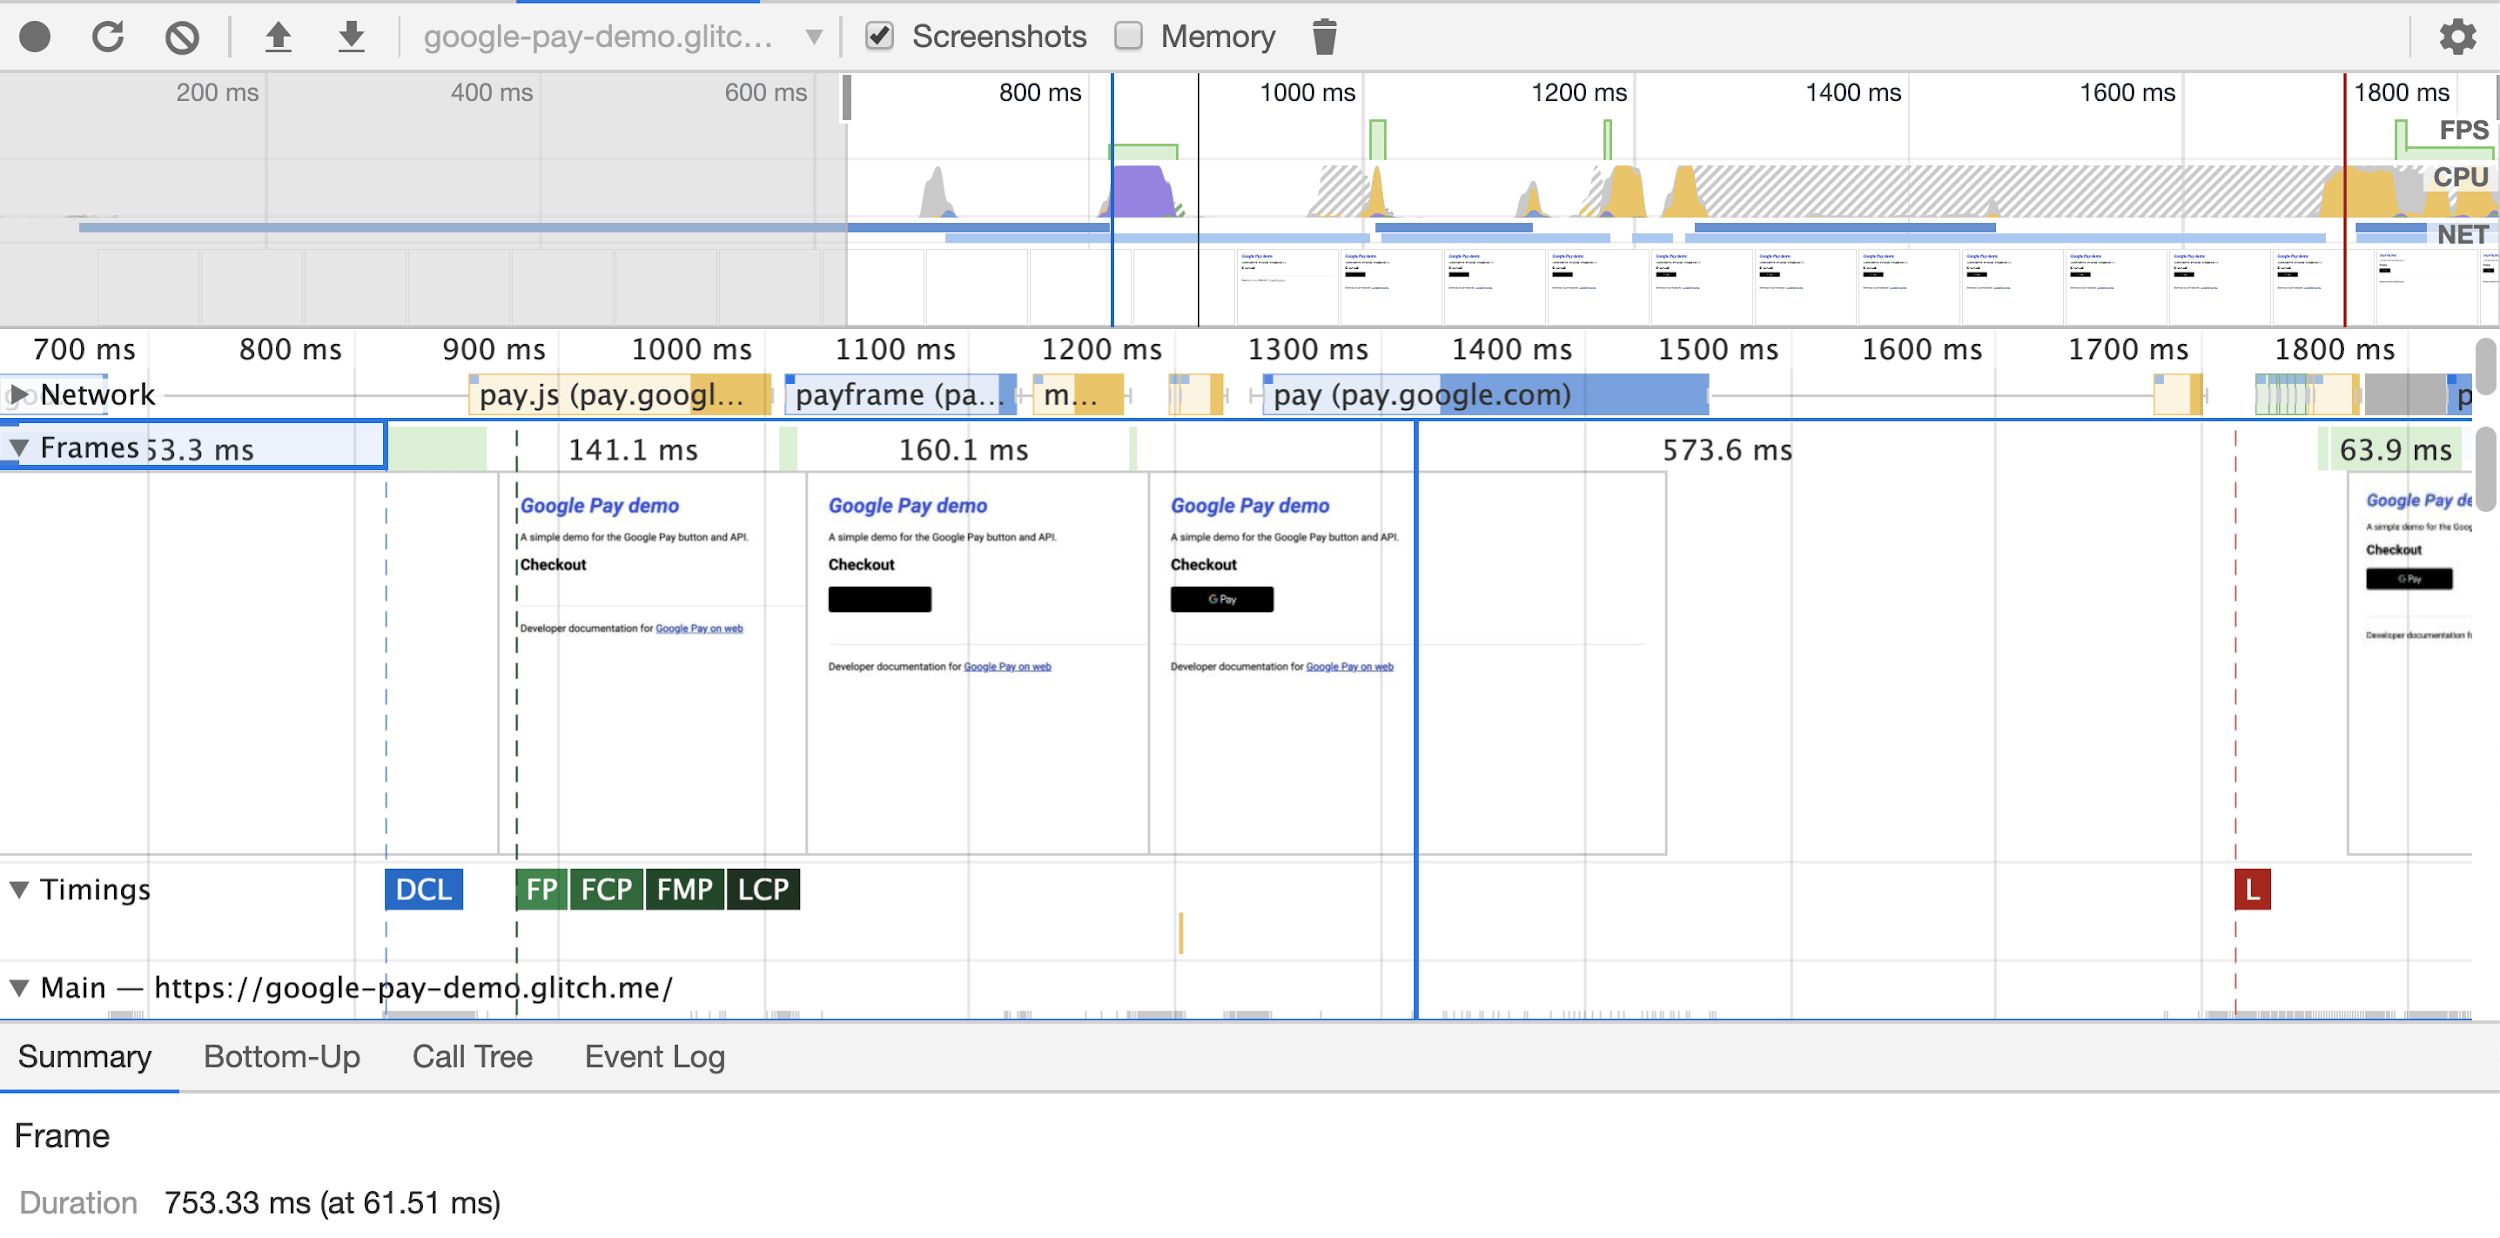
- Get a DevTools performance trace for a page load
- Get a DevTools trace with screenshots
- Get a DevTools trace and extract filmstrip screenshots
- Get a DevTools trace for a user interaction
- Get Runtime performance metrics
- Generate a Lighthouse report
- Extract Lighthouse performance metrics
- Emulate a slow network
- Emulate a slow network and CPU
- Test your site renders with JavaScript disabled
- Get Navigation Timing API metrics
- Measure First Paint and First Contentful Paint
- Measure Largest Contentful Paint w/PerformanceObserver
- Measure Cumulative Layout Shift w/PerformanceObserver
- Measure SPA metrics with Next.js
- Get DevTools-specific metrics: Frames Per Second
- Measure memory leaks
- Override requests with Request Interception
- Block third-party domains
- Code Coverage for JavaScript and CSS
This guide has recipes for automating Web Performance measurement with Puppeteer. An accompanying GitHub repository for this write-up is also available.
Get a DevTools performance trace for a page load
Puppeteer API: tracing.start()
const puppeteer = require('puppeteer');

(async () => {
    const browser = await puppeteer.launch();
    const page = await browser.newPage();
    // Drag and drop this JSON file to the DevTools Performance panel!
    await page.tracing.start({ path: 'profile.json' });
    await page.goto('https://pptr.dev');
    await page.tracing.stop();
    await browser.close();
})();

Get a DevTools trace with screenshots
Puppeteer API: tracing.start()
const puppeteer = require('puppeteer');

(async () => {
    const browser = await puppeteer.launch();
    const page = await browser.newPage();
    // Drag and drop this JSON file to the DevTools Performance panel!
    await page.tracing.start({ path: 'profile.json', screenshots: true });
    await page.goto('https://pptr.dev');
    await page.tracing.stop();
    await browser.close();
})();

Get a DevTools trace and extract filmstrip screenshots
If you would like to record a performance trace and extract filmstrip screenshots from that trace to a local directory, the below snippet should do the trick. It works by filtering trace events for screenshot entries.
const puppeteer = require('puppeteer');
const fs = require('fs');

(async () => {
  const browser = await puppeteer.launch();
  const page = await browser.newPage();

  await page.tracing.start({ screenshots: true, path: 'trace.json' });
  await page.goto('https://netflix.com', { timeout: 60000 });
  await page.tracing.stop();

  // Extract data from the trace
  const tracing = JSON.parse(fs.readFileSync('./trace.json', 'utf8'));
  const traceScreenshots = tracing.traceEvents.filter(x => (
      x.cat === 'disabled-by-default-devtools.screenshot' &&
      x.name === 'Screenshot' &&
      typeof x.args !== 'undefined' &&
      typeof x.args.snapshot !== 'undefined'
  ));

  traceScreenshots.forEach(function(snap, index) {
    fs.writeFile(`trace-screenshot-${index}.png`, snap.args.snapshot, 'base64', function(err) {
      if (err) {
        console.log('writeFile error', err);
      }
    });
  });

  await browser.close();
})();

Get a DevTools trace for a user interaction
Puppeteer API: page.click()
const puppeteer = require('puppeteer');

(async () => {
  const browser = await puppeteer.launch();
  const page = await browser.newPage();
  const navigationPromise = page.waitForNavigation();
  await page.goto('https://pptr.dev/#?product=Puppeteer&version=v2.1.1&show=outline');
  await page.setViewport({ width: 1440, height: 714 });

  await navigationPromise;
  const selector = 'body > sidebar-component > sidebar-item:nth-child(3) > .pptr-sidebar-item';
  await page.waitForSelector(selector);
  await page.tracing.start({path: 'trace.json', screenshots: true});
  await page.click(selector);
  await page.tracing.stop();

  await browser.close();
})();

Get Runtime performance metrics
The page.metrics() returns runtime metrics from the Chrome DevTools Protocol Performance.getMetrics() method, such as layout duration, recalc-style durations and JS event listeners.
Puppeteer API: metrics()
const puppeteer = require('puppeteer');

(async () => {
    const browser = await puppeteer.launch();
    const page = await browser.newPage();
    await page.goto('https://pptr.dev');

    const metrics = await page.metrics();
    console.info(metrics);

    await browser.close();
})();

Generate a Lighthouse report
Generate a Lighthouse report for a URL and output it to a local HTML file. For more details, see the official guide to using Puppeteer with Lighthouse.
Puppeteer API: connect()
const fs = require('fs');
const lighthouse = require('lighthouse');
const puppeteer = require('puppeteer');

const chromeLauncher = require('chrome-launcher');
const reportGenerator = require('lighthouse/lighthouse-core/report/report-generator');
const request = require('request');
const util = require('util');

const options = {
  logLevel: 'info',
  disableDeviceEmulation: true,
  chromeFlags: ['--disable-mobile-emulation']
};

async function lighthouseFromPuppeteer(url, options, config = null) {
  // Launch chrome using chrome-launcher
  const chrome = await chromeLauncher.launch(options);
  options.port = chrome.port;

  // Connect chrome-launcher to puppeteer
  const resp = await util.promisify(request)(`http://localhost:${options.port}/json/version`);
  const { webSocketDebuggerUrl } = JSON.parse(resp.body);
  const browser = await puppeteer.connect({ browserWSEndpoint: webSocketDebuggerUrl });

  // Run Lighthouse
  const { lhr } = await lighthouse(url, options, config);
  await browser.disconnect();
  await chrome.kill();

  const html = reportGenerator.generateReport(lhr, 'html');
  fs.writeFile('report.html', html, function (err) {
    if (err) throw err;
  });
}

lighthouseFromPuppeteer("https://pptr.dev", options);

Extract Lighthouse performance metrics
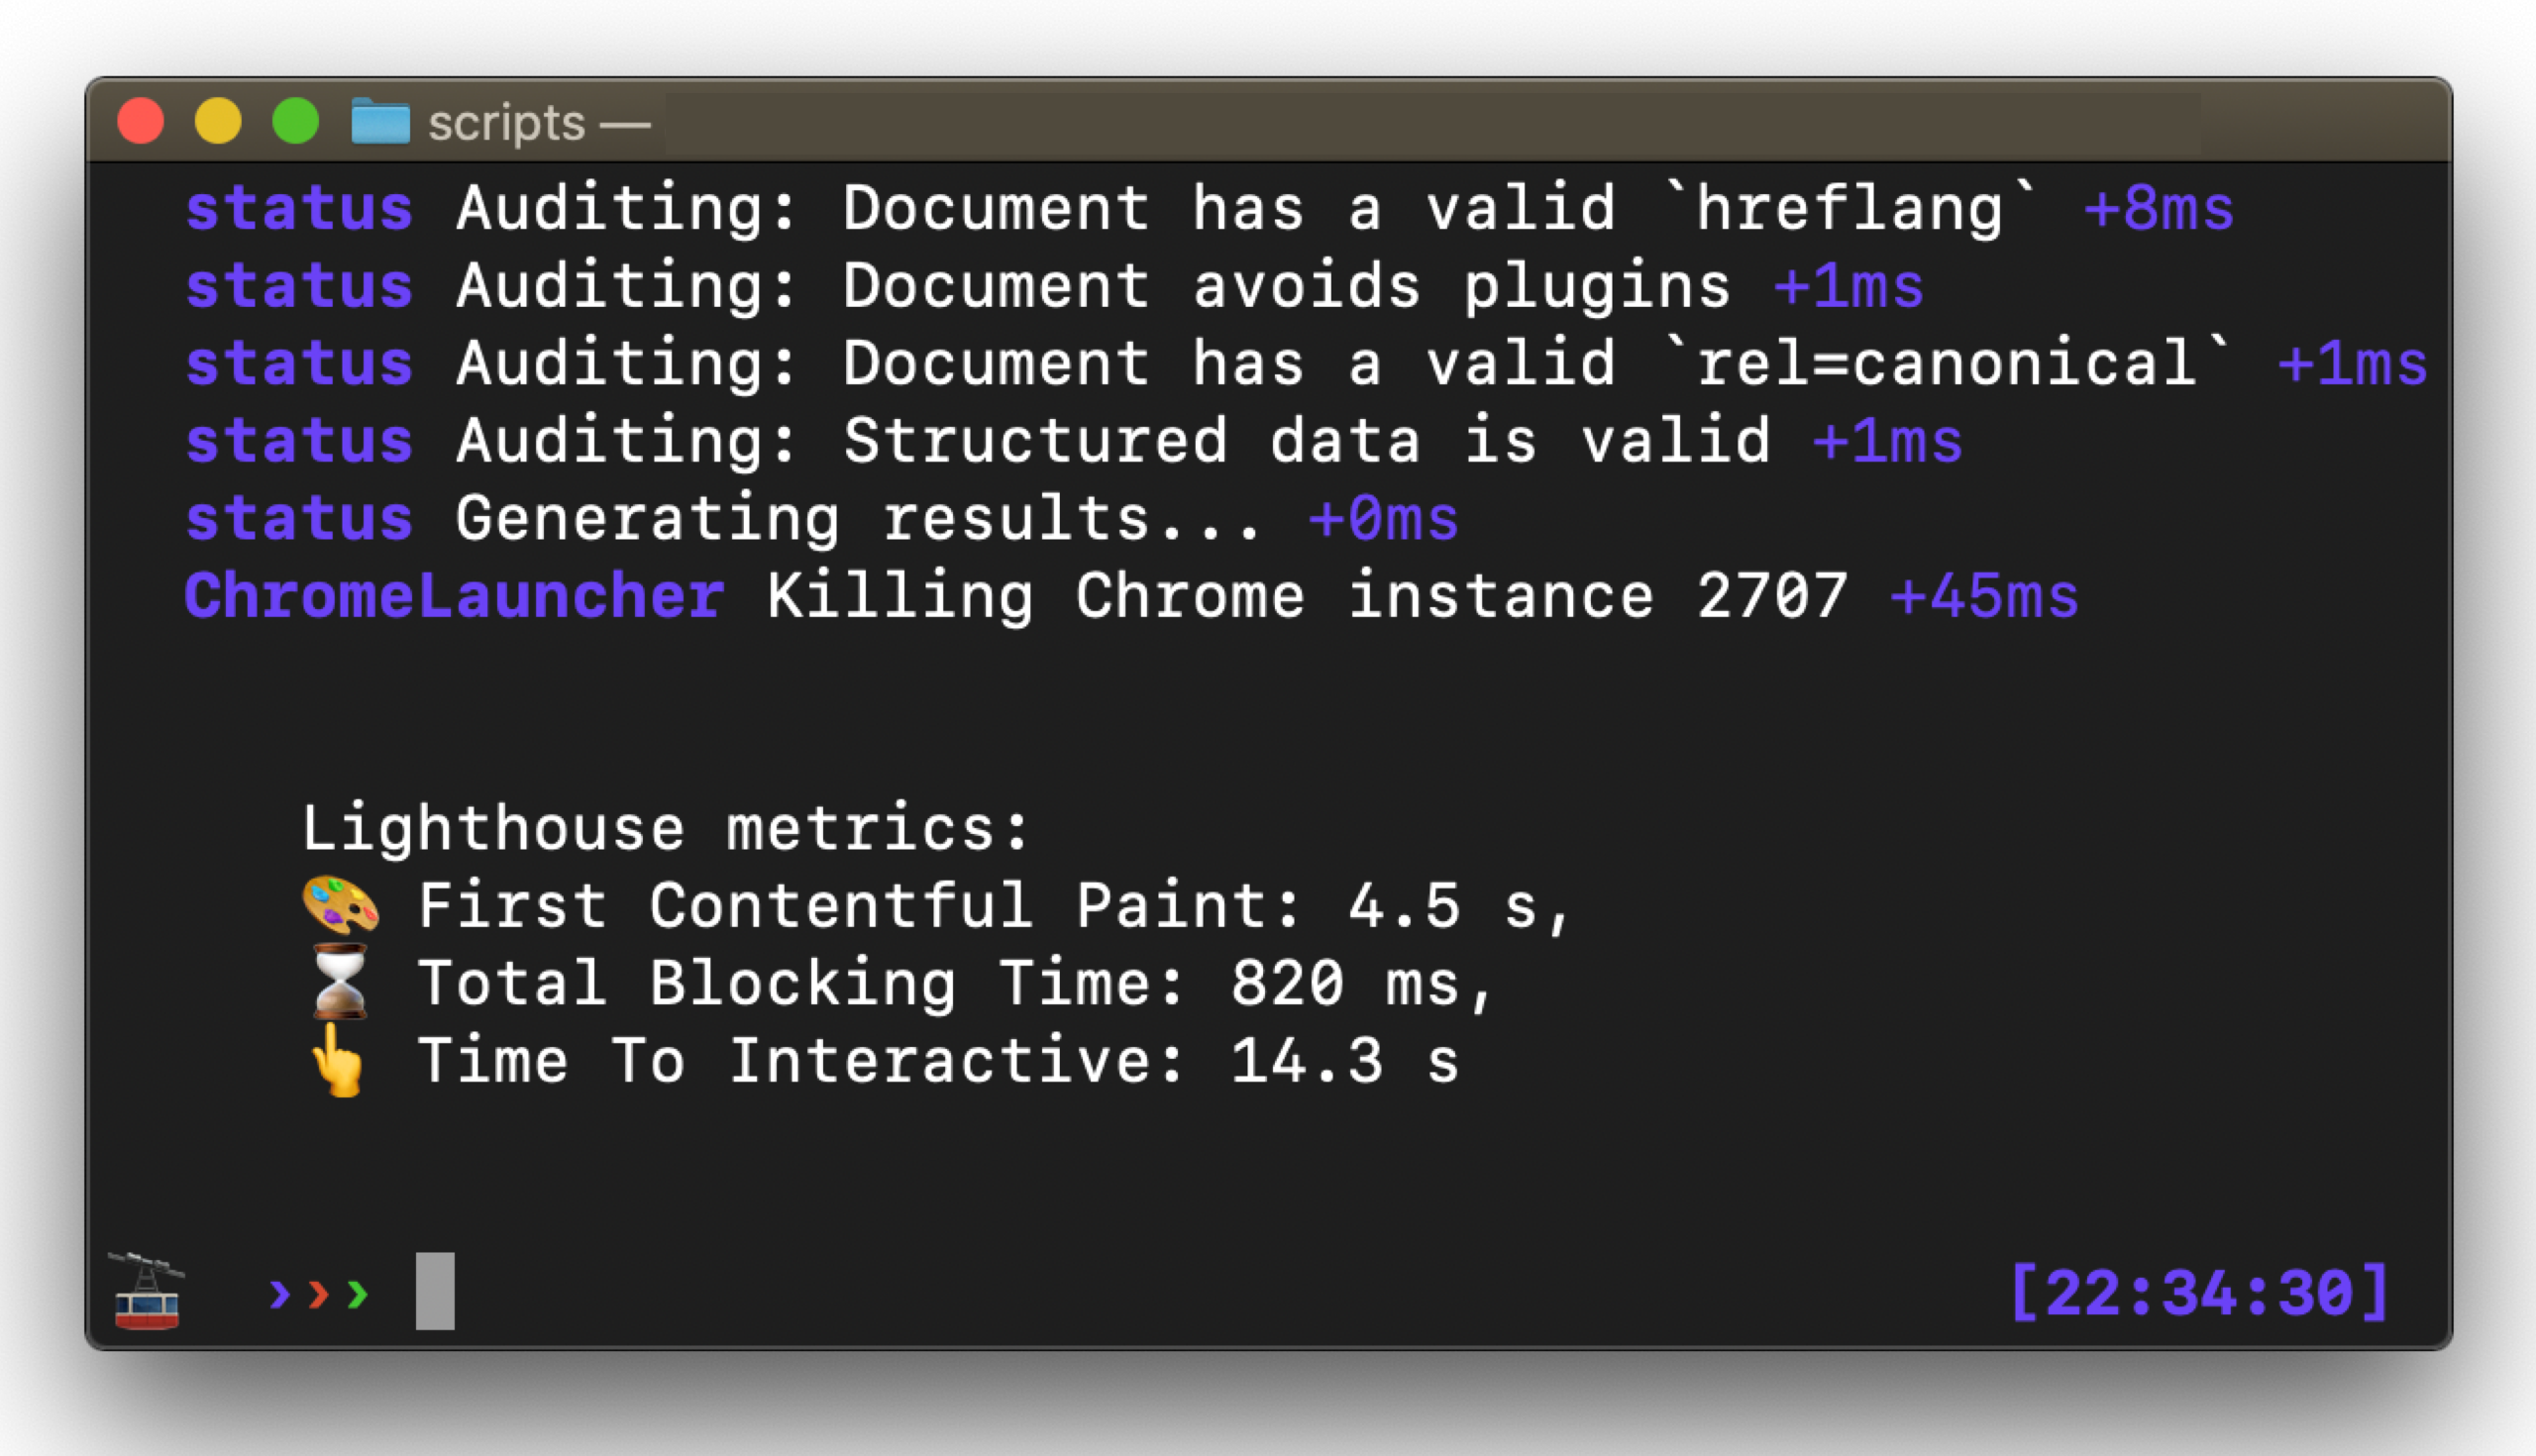
Lighthouse exposes a number of user-centric performance metrics. It’s possible to pluck these metrics values out from the JSON response, as demonstrated below.
const fs = require('fs');
const lighthouse = require('lighthouse');
const puppeteer = require('puppeteer');

const chromeLauncher = require('chrome-launcher');
const reportGenerator = require('lighthouse/lighthouse-core/report/report-generator');
const request = require('request');
const util = require('util');

const options = {
  logLevel: 'info',
  disableDeviceEmulation: true,
  chromeFlags: ['--disable-mobile-emulation']
};

async function lighthouseFromPuppeteer(url, options, config = null) {
  // Launch chrome using chrome-launcher
  const chrome = await chromeLauncher.launch(options);
  options.port = chrome.port;

  // Connect chrome-launcher to puppeteer
  const resp = await util.promisify(request)(`http://localhost:${options.port}/json/version`);
  const { webSocketDebuggerUrl } = JSON.parse(resp.body);
  const browser = await puppeteer.connect({ browserWSEndpoint: webSocketDebuggerUrl });

  // Run Lighthouse
  const { lhr } = await lighthouse(url, options, config);
  await browser.disconnect();
  await chrome.kill();

  const json = reportGenerator.generateReport(lhr, 'json');

  const audits = JSON.parse(json).audits; // Lighthouse audits
  const first_contentful_paint = audits['first-contentful-paint'].displayValue;
  const total_blocking_time = audits['total-blocking-time'].displayValue;
  const time_to_interactive = audits['interactive'].displayValue;

  console.log(`\n
     Lighthouse metrics:
     🎨 First Contentful Paint: ${first_contentful_paint},
     ⌛️ Total Blocking Time: ${total_blocking_time},
     👆 Time To Interactive: ${time_to_interactive}`);
}

lighthouseFromPuppeteer("https://bbc.com", options);

Emulate a slow network
If you need to throttle the network connection, use Network.emulateNetworkConditions via the Chrome DevTools Protocol. You can borrow configuration details for what is used in the DevTools Network panel for emulation details.
Emulating a Slow 3G network is demonstrated below.
const puppeteer = require('puppeteer');

(async () => {
  let browser = await puppeteer.launch();
  let page = await browser.newPage();

  const client = await page.target().createCDPSession();
  await client.send('Network.enable');
  // Simulated network throttling (Slow 3G)
  await client.send('Network.emulateNetworkConditions', {
  // Network connectivity is absent
  'offline': false,
  // Download speed (bytes/s)
  'downloadThroughput': 500 * 1024 / 8 * .8,
  // Upload speed (bytes/s)
  'uploadThroughput': 500 * 1024 / 8 * .8,
  // Latency (ms)
  'latency': 400 * 5
});
  await browser.close();
})();
You can find details on the presets DevTools supports for Slow and Fast 3G in the official source. If you are looking for the older presets around Regular 4G, WiFi etc, they are captured in network throttling in Puppeteer.
Emulate a slow network and CPU
CPU throttling allows you to simulate how a page performs on slower mobile devices. This can be done using Network.emulateNetworkConditions via the Chrome DevTools Protocol.
Building on top of Slow 3G network throttling, slow CPU throttling (4x slowdown - close to a median-quality device like the Moto G4), is shown below. </div>
const puppeteer = require('puppeteer');

(async () => {
  let browser = await puppeteer.launch();
  let page = await browser.newPage();

  const client = await page.target().createCDPSession();
  await client.send('Network.enable');
  // Simulated network throttling (Slow 3G)
  await client.send('Network.emulateNetworkConditions', {
  // Network connectivity is absent
  'offline': false,
  // Download speed (bytes/s)
  'downloadThroughput': 500 * 1024 / 8 * .8,
  // Upload speed (bytes/s)
  'uploadThroughput': 500 * 1024 / 8 * .8,
  // Latency (ms)
  'latency': 400 * 5
});
  await client.send('Emulation.setCPUThrottlingRate', { rate: 4 });
  await browser.close();
})();
Test your site renders with JavaScript disabled
Situations with intermittant connectivity may mean JS is effectively disabled until it can be loaded. Testing a page with JS disabled allows you to simulate a ‘worst case’ for this.
Puppeteer API: setRequestInterception()
const puppeteer = require('puppeteer');

(async () => {
    const browser = await puppeteer.launch();
    const page = await browser.newPage();
    await page.setRequestInterception(true);

    page.on('request', request => {
        if (request.resourceType() === 'script') {
            request.abort();
        } else {
            request.continue();
        }
    });

    await page.goto('https://reddit.com');
    await page.screenshot({ path: 'pptr-nojs.png' });

    await browser.close();
})();

Get Navigation Timing API metrics
const puppeteer = require('puppeteer');

(async () => {
  const browser = await puppeteer.launch();
  const page = await browser.newPage();
  await page.goto('https://pptr.dev');
  const performanceTiming = JSON.parse(
      await page.evaluate(() => JSON.stringify(window.performance.timing))
  );
  console.log('performanceTiming', performanceTiming)
  await browser.close();
})();

Measure First Paint & First Contentful Paint
Metric: First Contentful Paint - web.dev
First Contentful Paint (FCP) metric measures the time from a page starting to load to when any part of the page’s content is rendered on the screen.
performance.getEntriesByName returns recorded performance entries based on the provided name (e.g "first-paint") and optionally the performance type.
const puppeteer = require('puppeteer');

(async () => {
  const browser = await puppeteer.launch();
  const page = await browser.newPage();
  const navigationPromise = page.waitForNavigation();
  await page.goto('https://pptr.dev');

  await navigationPromise;

  let firstPaint = JSON.parse(
    await page.evaluate(() =>
      JSON.stringify(performance.getEntriesByName('first-paint'))
    )
  );

  let firstContentfulPaint = JSON.parse(
    await page.evaluate(() =>
      JSON.stringify(performance.getEntriesByName('first-contentful-paint'))
    )
  );

  console.log(`First paint: ${firstPaint[0].startTime}`);
  console.log(`First paint: ${firstContentfulPaint[0].startTime}`);

  await browser.close();
})();
Measure Largest Contentful Paint (LCP) w/PerformanceObserver
Metric: Largest Contentful Paint - web.dev
The Largest Contentful Paint (LCP) metric reports render time for the largest content element visible in the viewport.
PerformanceObserver allows you to observe performance measurement events and get notified of new performance entries as they are recorded in the browser's performance timeline. When measuring modern metrics like LCP or CLS with PerformanceObserver, you probably want to wait until the page's lifecycle state has changed to hidden. This ensures that you log the most latest entry.
const puppeteer = require('puppeteer');
const devices = require('puppeteer/DeviceDescriptors');

const Good3G = {
    'offline': false,
    'downloadThroughput': 1.5 * 1024 * 1024 / 8,
    'uploadThroughput': 750 * 1024 / 8,
    'latency': 40
};

const phone = devices['Nexus 5X'];

function calcLCP() {
    window.largestContentfulPaint = 0;

    const observer = new PerformanceObserver((entryList) => {
        const entries = entryList.getEntries();
        const lastEntry = entries[entries.length - 1];
        window.largestContentfulPaint = lastEntry.renderTime || lastEntry.loadTime;
    });

    observer.observe({ type: 'largest-contentful-paint', buffered: true });

    document.addEventListener('visibilitychange', () => {
        if (document.visibilityState === 'hidden') {
            observer.takeRecords();
            observer.disconnect();
            console.log('LCP:', window.largestContentfulPaint);
        }
    });
}


async function getLCP(url) {
    const browser = await puppeteer.launch({
        args: ['--no-sandbox'],
        timeout: 10000
    });

    try {
        const page = await browser.newPage();
        const client = await page.target().createCDPSession();

        await client.send('Network.enable');
        await client.send('ServiceWorker.enable');
        await client.send('Network.emulateNetworkConditions', Good3G);
        await client.send('Emulation.setCPUThrottlingRate', { rate: 4 });
        await page.emulate(phone);

        await page.evaluateOnNewDocument(calcLCP);
        await page.goto(url, { waitUntil: 'load', timeout: 60000 });

        let lcp = await page.evaluate(() => {
            return window.largestContentfulPaint;
        });
        return lcp;
        browser.close();
    } catch (error) {
        console.log(error);
        browser.close();
    }
}

getLCP("https://pptr.dev").then(lcp => console.log("LCP is: " + lcp));

Measure Cumulative Layout Shift (CLS) w/PerformanceObserver
Metric: Cumulative Layout Shift - web.dev
The Cumulative Layout Shift (CLS) metric measures the sum of individual layout shift scores for each unexpected layout shift that occurs between when the page begins loading and when its lifecycle state changes to hidden.
PerformanceObserver allows you to observe performance measurement events and get notified of new performance entries as they are recorded in the browser's performance timeline. When measuring modern metrics like CLS or LCP with PerformanceObserver, you probably want to wait until the page's lifecycle state has changed to hidden. This ensures that you log the most latest entry.
const puppeteer = require('puppeteer');
const devices = require('puppeteer/DeviceDescriptors');

const Good3G = {
    'offline': false,
    'downloadThroughput': 1.5 * 1024 * 1024 / 8,
    'uploadThroughput': 750 * 1024 / 8,
    'latency': 40
  };

const phone = devices['Nexus 5X'];

function calcJank() {
  window.cumulativeLayoutShiftScore = 0;

  const observer = new PerformanceObserver((list) => {
   for (const entry of list.getEntries()) {
     if (!entry.hadRecentInput) {
       console.log("New observer entry for cls: " + entry.value);
       window.cumulativeLayoutShiftScore += entry.value;
     }
   }
  });

  observer.observe({type: 'layout-shift', buffered: true});

  document.addEventListener('visibilitychange', () => {
   if (document.visibilityState === 'hidden') {
     observer.takeRecords();
     observer.disconnect();
     console.log('CLS:', window.cumulativeLayoutShiftScore);
   }
  });
}


async function getCLS(url) {
   const browser = await puppeteer.launch({
     args: ['--no-sandbox'],
     timeout: 10000
   });

  try {
    const page = await browser.newPage();
    const client = await page.target().createCDPSession();

    await client.send('Network.enable');
    await client.send('ServiceWorker.enable');
    await client.send('Network.emulateNetworkConditions', Good3G);
    await client.send('Emulation.setCPUThrottlingRate', { rate: 4 });
    await page.emulate(phone);
    // inject a function with the code from
    // https://web.dev/cls/#measure-cls-in-javascript
    await page.evaluateOnNewDocument(calcJank);
    await page.goto(url, { waitUntil: 'load', timeout: 60000});

    let cls = await page.evaluate(() => {
        return window.cumulativeLayoutShiftScore;
    });
    return cls;
    browser.close();
  } catch (error) {
    console.log(error);
    browser.close();
  }
}

getCLS("https://pptr.dev").then(cls => console.log("CLS is: " + cls));

Measure SPA metrics with Next.js
performance.mark() and performance.measure.
Outside of the performance metrics made available via the Navigation Timing API, single-page apps (SPA) often also have custom metrics for tracking other key moments. In Next.js, these could correspond to Time-to-Hydrate, SPA route transitions and so on.
Next.js recently added the https://github.com/zeit/next.js/pull/8480 helper for tracking client-side performance metrics using performance.mark and performance.measure. The below Puppeteer script allows us to collect this performance data once you patch your app to log key events to localStorage as in this Glitch example by Houssein Djirdeh.
const puppeteer = require('puppeteer');

(async () => {
    const browser = await puppeteer.launch()
    const page = await browser.newPage()
    let selector = '';
    page.on('load', () => console.log("Loaded: " + page.url()));
    page.on('framenavigated', frame => {
        console.log(`new url: ${frame.url()}`);
    });

    const navigationPromise = page.waitForNavigation({
        waitUntil: 'networkidle2'
    })

    // Navigate to random Next.js page
    await page.goto('https://new-app-3-op9eiblak.now.sh/')

    console.log('\n==== localStorage hydration entry ====\n');
    const hydrationData = await page.evaluate(() => {
        const data = {
            'before-hydrate-mark': localStorage.getItem('beforeRender'),
            'after-hydrate-mark': Number(localStorage.getItem('beforeRender')) + Number(localStorage.getItem('Next.js-hydration')),
            'hydration-duration': localStorage.getItem('Next.js-hydration'),
        };
        return data;
    });

    console.log(hydrationData);

    await page.screenshot({
        path: 'home-page.png',
        fullPage: true
    });

    await navigationPromise;

    // Navigate to the Blog
    selector = '#__next > div > nav > ul > li:nth-child(1) > a';
    await Promise.all([
        await page.waitForSelector(selector),
        await page.click(selector, {
            delay: 300
        }),
        await page.waitFor(4000),
        await navigationPromise
    ]);

    console.log('\n==== localStorage route change performance entries ====\n');
    const routeChangeData = await page.evaluate(() => {
        const data = {
            'link-click-to-render-start-duration': localStorage.getItem('Next.js-route-change-to-render'),
            'render-duration': localStorage.getItem('Next.js-render')
        };
        return data;
    });

    console.log(routeChangeData);

    await page.screenshot({
        path: 'blog-page.png',
        fullPage: true
    });

    await browser.close();
})();
Get DevTools-specific metrics: Frames Per Second
It’s possible to open a remote debugging client and turn on DevTools-specific features, such as the frames-per-second (FPS) heads-up-display.
Puppeteer API: createCDPSession()
const puppeteer = require('puppeteer');

(async () => {
    const args = await puppeteer.defaultArgs().filter(flag => flag !== '--enable-automation');
    const browser = await puppeteer.launch({
        headless: false,
        devtools: true,
        ignoreDefaultArgs: true,
        args
    });
    const page = await browser.newPage();
    const devtoolsProtocolClient = await page.target().createCDPSession();
    await devtoolsProtocolClient.send('Overlay.setShowFPSCounter', { show: true });
    await page.goto('https://pptr.dev');
    await page.screenshot({ path: './image.jpg', type: 'jpeg' });
    await page.close();
    await browser.close();
})();

Measure memory leaks
Checking the number of objects retained on the heap can be a good basic start to measuring memory leaks in JavaScript. In Puppeteer, queryObjects() can be used to count all the objects with the same prototype somewhere in the prototype chain.
Puppeteer API: queryObjects()
For a more detailed look at this topic, check out automatically detecting memory-leaks with Puppeteer.
const puppeteer = require('puppeteer');

// Helper by @chrisguttandin
const countObjects = async (page) => {
    const prototypeHandle = await page.evaluateHandle(() => Object.prototype);
    const objectsHandle = await page.queryObjects(prototypeHandle);
    const numberOfObjects = await page.evaluate((instances) => instances.length, objectsHandle);

    await Promise.all([
        prototypeHandle.dispose(),
        objectsHandle.dispose()
    ]);

    return numberOfObjects;
};

(async () => {
    const browser = await puppeteer.launch();
    const page = await browser.createIncognitoBrowserContext();

    const numberOfObjects = await countObjects(page);
    console.log(numberOfObjects);

    await page.evaluate(() => {
        class SomeObject {
            constructor () {
              this.numbers = {}
              for (let i = 0; i < 1000; i++) {
                this.numbers[Math.random()] = Math.random()
              }
            }
        }
        const someObject = new SomeObject();
        const onMessage = () => { /* ... */ };
        window.addEventListener('message', onMessage);
    });

    const numberOfObjectsAfter = await countObjects(page);
    console.log(numberOfObjectsAfter);

    // Check if the number of retained objects is expected
    // expect(await countObjects(page)).to.equal(0);

    await browser.close();
})();
Override requests with Request Interception
Request interception (overrides) allows you to modify network requests that are made by a page.
Puppeteer API: setRequestInterception()
Block requests for images
import puppeteer from 'puppeteer';

(async () => {
    const browser = await puppeteer.launch();
    const page = await browser.newPage();

    await page.setRequestInterception(true);

    page.on('request', (req) => {
        if (req.resourceType() === 'image'){
            req.abort();
        }
        else {
            req.continue();
        }
    });

    await page.goto('https://bbc.com');
    await page.screenshot({path: 'no-images.png', fullPage: true});
    await browser.close();
})();
Replace a remote resource with a local one
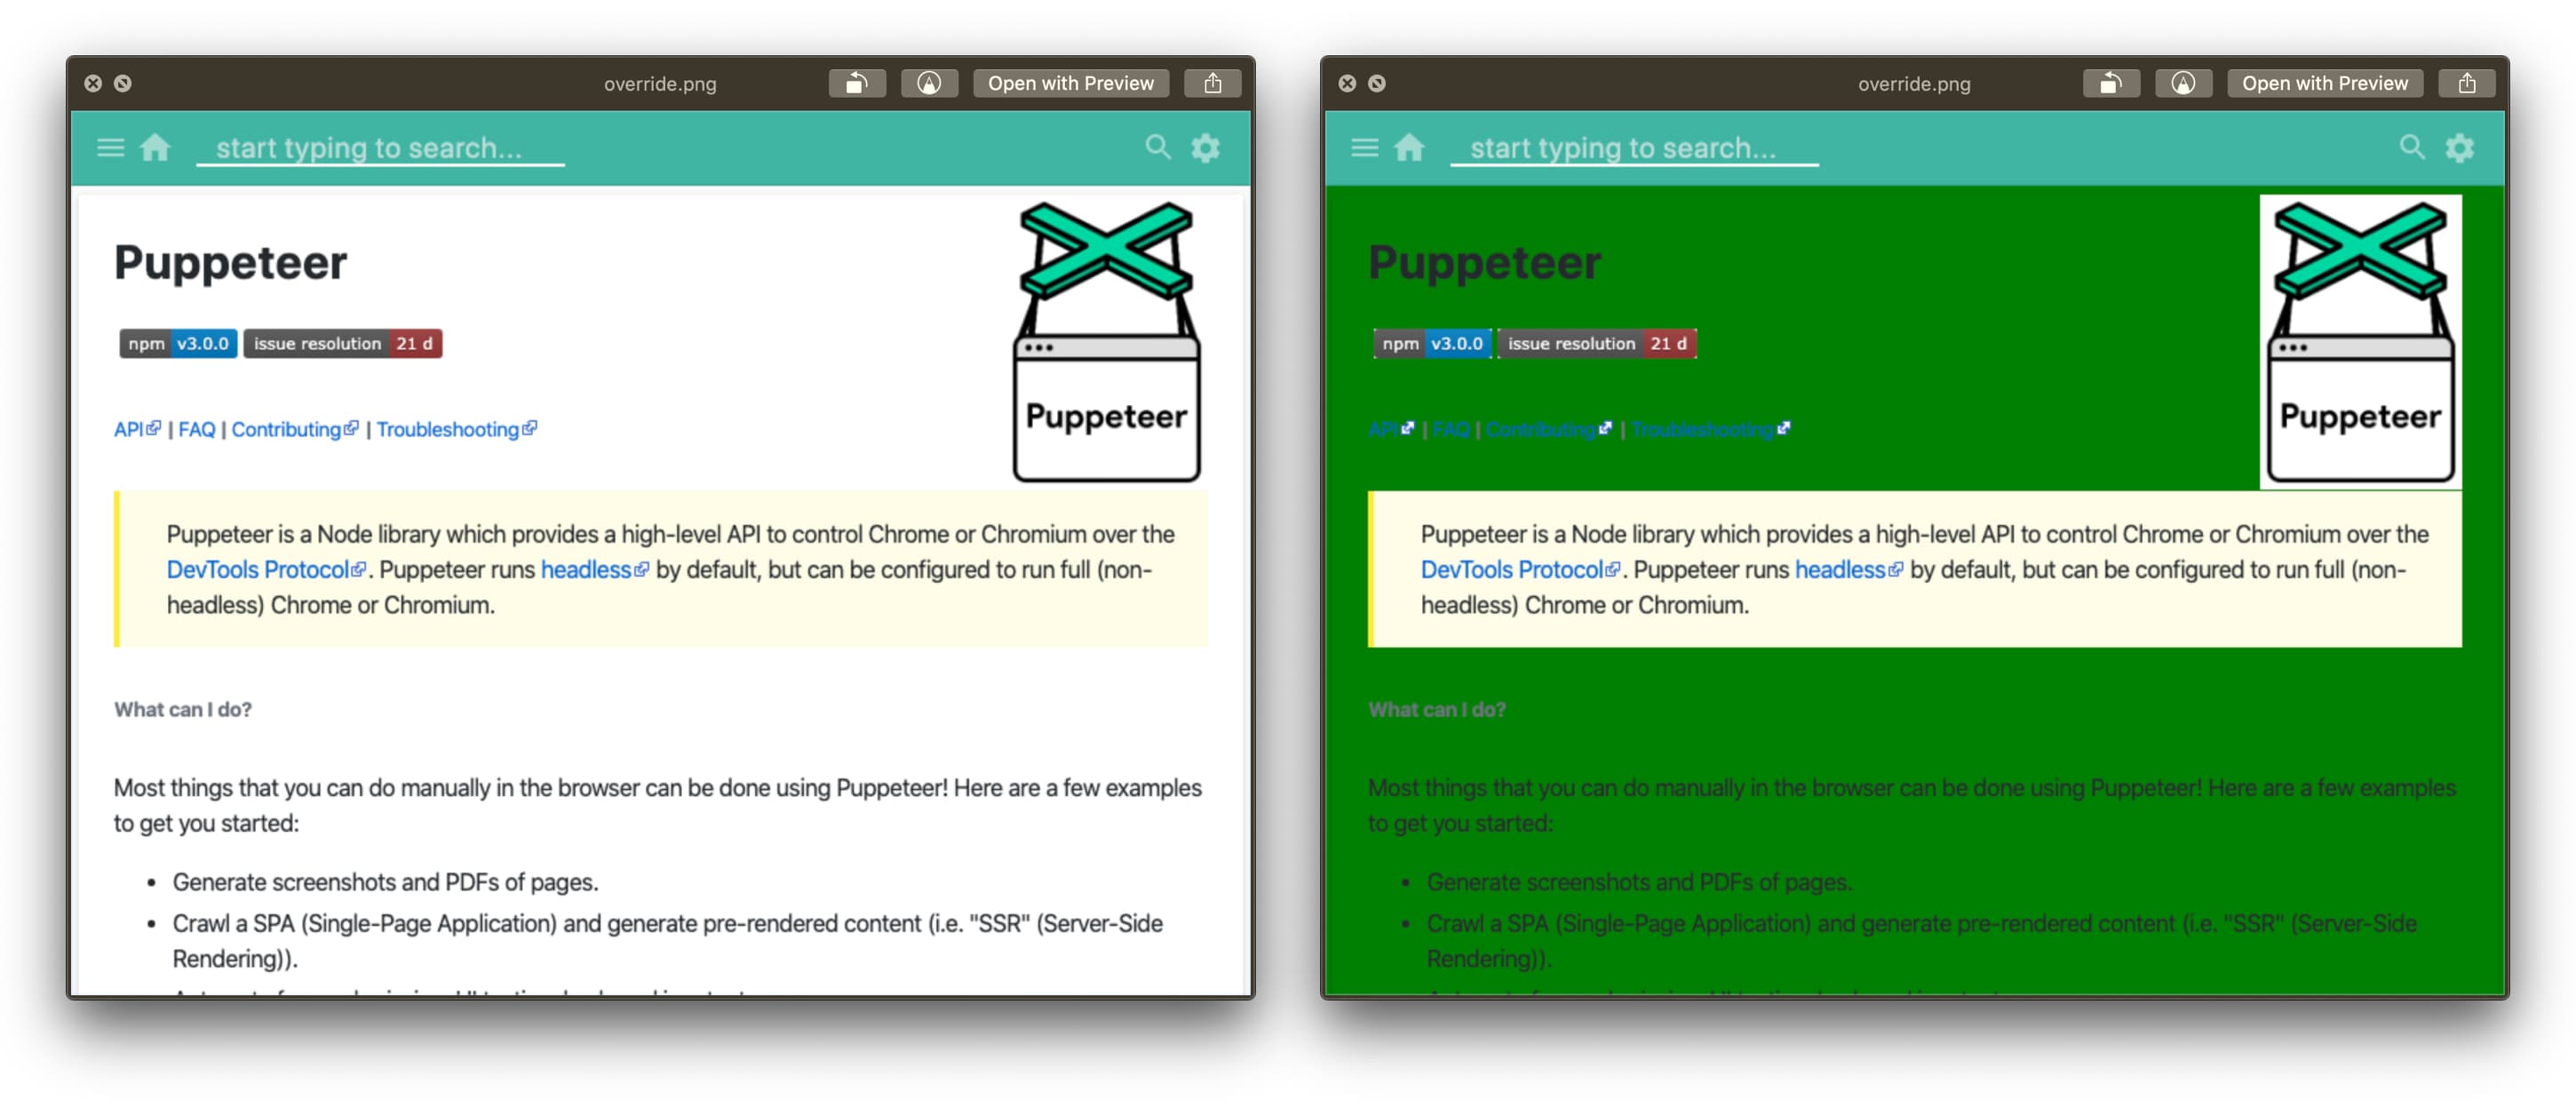
In the below snippet, we override a remote resource for the Puppeteer site (pptr.dev/style.css) with a local version (assets/style.css). In the version served, you’ll see the Puppeteer site is rendered with our green background colors instead.
const puppeteer = require('puppeteer');
const fs = require('fs');
const path = require('path');

(async () => {

  const browser = await puppeteer.launch();
  const page = await browser.newPage();
  // URL to test
  const remoteURL = 'https://pptr.dev/index.html';
  // URL to replace
  const remoteFilePath = 'https://pptr.dev/style.css';
  // Local (override) file to use instead
  const localFilePath = path.join(__dirname, "./assets/style.css");

  await page.setRequestInterception(true);

  page.on("request", interceptedRequest => {
    const url = interceptedRequest.url();
    console.log(`Intercepted ${url}`);

    if (url === remoteFilePath && !url.match(localFilePath)) {
      interceptedRequest.respond({
        body: fs.readFileSync(
          localFilePath
        )
      });
    } else {
      interceptedRequest.continue();
    }
  });

  await page.goto(`https://pptr.dev/index.html`, {
    waitUntil: "networkidle2"
  });

  await page.screenshot({path: 'override.png', fullPage: true});
  await browser.close();

})();

While this example doesn’t demonstrate it, you could use network overrides to experiment with the before/after for a number of different performance optimizations.
Block third-party domains
You can block specific requests using Puppeteer’s request interception feature. This can be helpful for profiling performance with specific domains blocked to see the before/after.
Puppeteer API: setRequestInterception
const puppeteer = require('puppeteer');

(async() => {
  const browser = await puppeteer.launch({
    headless: true
  });
  const page = await browser.newPage();
  const options = {
    waitUntil: 'networkidle2',
    timeout: 30000
  };

  // Before: Normal navigtation
  await page.goto('https://theverge.com', options);
  await page.screenshot({path: 'before.png', fullPage: true});
  const metrics = await page.metrics();
  console.info(metrics);

  // After: Navigation with some domains blocked

  // Array of third-party domains to block
  const blockedDomains = [
    'https://pagead2.googlesyndication.com',
    'https://creativecdn.com',
    'https://www.googletagmanager.com',
    'https://cdn.krxd.net',
    'https://adservice.google.com',
    'https://cdn.concert.io',
    'https://z.moatads.com',
    'https://cdn.permutive.com'];
  await page.setRequestInterception(true);
  page.on('request', request => {
    const url = request.url()
    if (blockedDomains.some(d => url.startsWith(d))) {
      request.abort();
    } else {
      request.continue();
    }
  });

  await page.goto('https://theverge.com', options);
  await page.screenshot({path: 'after.png', fullPage: true});

  const metricsAfter = await page.metrics();
  console.info(metricsAfter);

  await browser.close();
})();

Code Coverage for JavaScript and CSS
Puppeteer API: page.coverage.startJSCoverage()
const puppeteer = require('puppeteer');

(async () => {
  const browser = await puppeteer.launch();
  const page = await browser.newPage();

  // Gather coverage for JS and CSS files
  await Promise.all([page.coverage.startJSCoverage(), page.coverage.startCSSCoverage()]);

  await page.goto('https://pptr.dev');

  // Stops the coverage gathering
  const [jsCoverage, cssCoverage] = await Promise.all([
    page.coverage.stopJSCoverage(),
    page.coverage.stopCSSCoverage(),
  ]);

  // Calculates # bytes being used based on the coverage
  const calculateUsedBytes = (type, coverage) =>
    coverage.map(({url, ranges, text}) => {
      let usedBytes = 0;

      ranges.forEach((range) => (usedBytes += range.end - range.start - 1));

      return {
        url,
        type,
        usedBytes,
        totalBytes: text.length,
        percentUsed: `${(usedBytes / text.length * 100).toFixed(2)}%`
      };
    });

  console.info([
    ...calculateUsedBytes('js', jsCoverage),
    ...calculateUsedBytes('css', cssCoverage),
  ]);

  await browser.close();
})();