Modern UX metrics on WebPageTest
April 3, 2020
This tip covers how to measure modern UX metrics on WebPageTest using the Custom Metrics feature.
On the Chrome team, we’ve recently been looking at a few new metrics we believe help better quantify what makes for a good user-experience on the web. These metrics include:
- Largest Contentful Paint - “how quickly does the main content of a web page load and is visible to users?” 🌅 This captures the render time of the largest content element visible in the viewport (e.g
<img>, block-level nodes containing text) - First Input Delay - “what’s the time from when I first click a link/button to when the browser can actually respond to that interaction?” ⏳👆
- Cumulative Layout Shift - “I was just about to click that! Why did it move?” 😭 This metric measures unexpected shifts in page layout.
In Chromium browsers, these metrics are available to record to your analytics via PerformanceObserver and you’ll see these metrics in Chrome’s developer tooling through the year (Lighthouse, DevTools, PageSpeed Insights and friends).
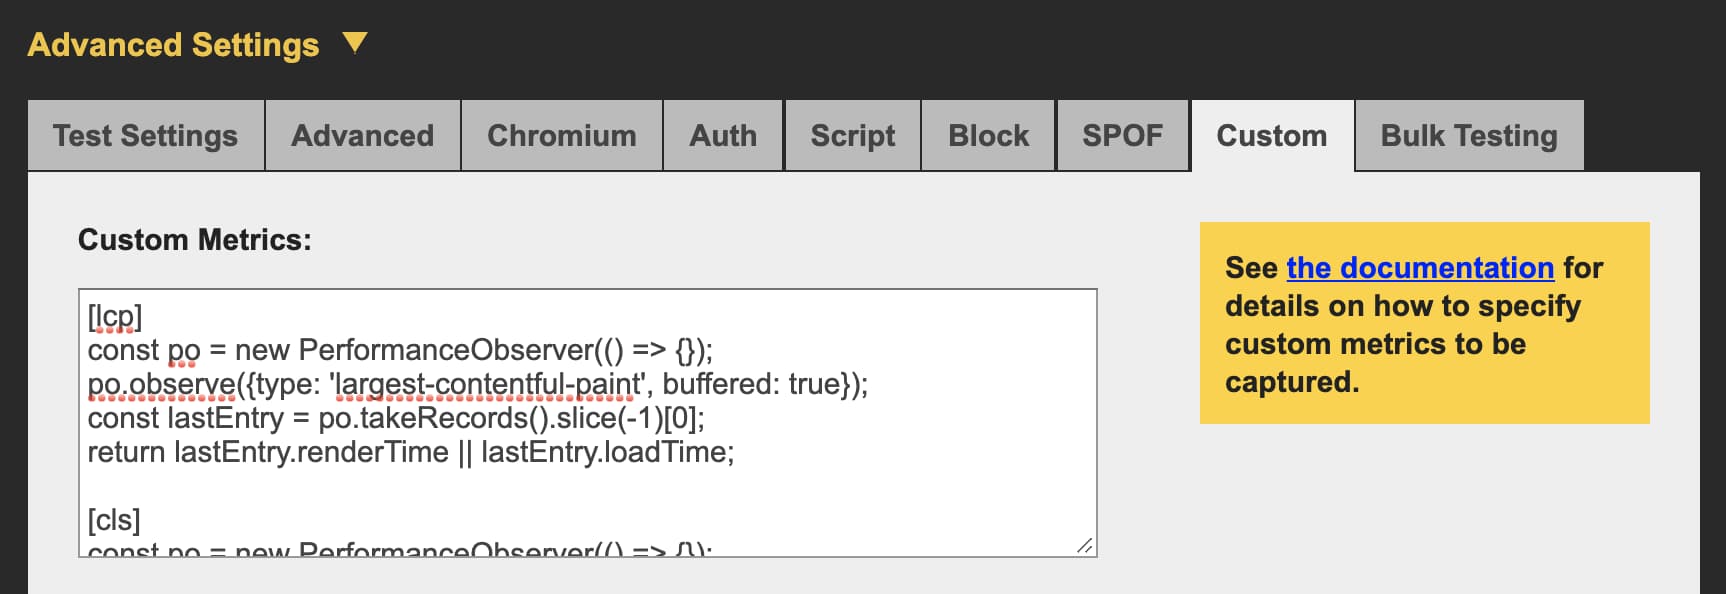
In case you are interested in also measuring these metrics on WebPageTest, it’s very much possible. You can add the below snippet to the Custom Metrics section under the Custom Tab in Advanced:

[lcp]
const po = new PerformanceObserver(() => {});
po.observe({type: 'largest-contentful-paint', buffered: true});
const lastEntry = po.takeRecords().slice(-1)[0];
return lastEntry.renderTime || lastEntry.loadTime;

[cls]
const po = new PerformanceObserver(() => {});
po.observe({type: 'layout-shift', buffered: true});
return po.takeRecords().reduce((val, entry) => val + entry.value, 0);

[fid]
const po = new PerformanceObserver(() => {});
po.observe({type: 'first-input', buffered: true});
const lastEntry = po.takeRecords().slice(-1)[0];
return lastEntry.processingStart - lastEntry.startTime;
You’ll then be able to see the values show up under the Details > Custom Metrics section of the report (example) or “Plot Full Results” link in the WebPageTest report.

The output for Plot Full Results looks as follows:

Keep in mind, WebPageTest runs custom metrics synchronously at the end of a run.
I believe WPT will likely gain native support for measuring these metrics without needing to use the above approach, but in case (like me) you’re after a stop-gap solution, this might help… 😀