Debugging Tactics
November 28, 2022
Debugging is the process of finding and fixing problems in software so that it functions as intended.
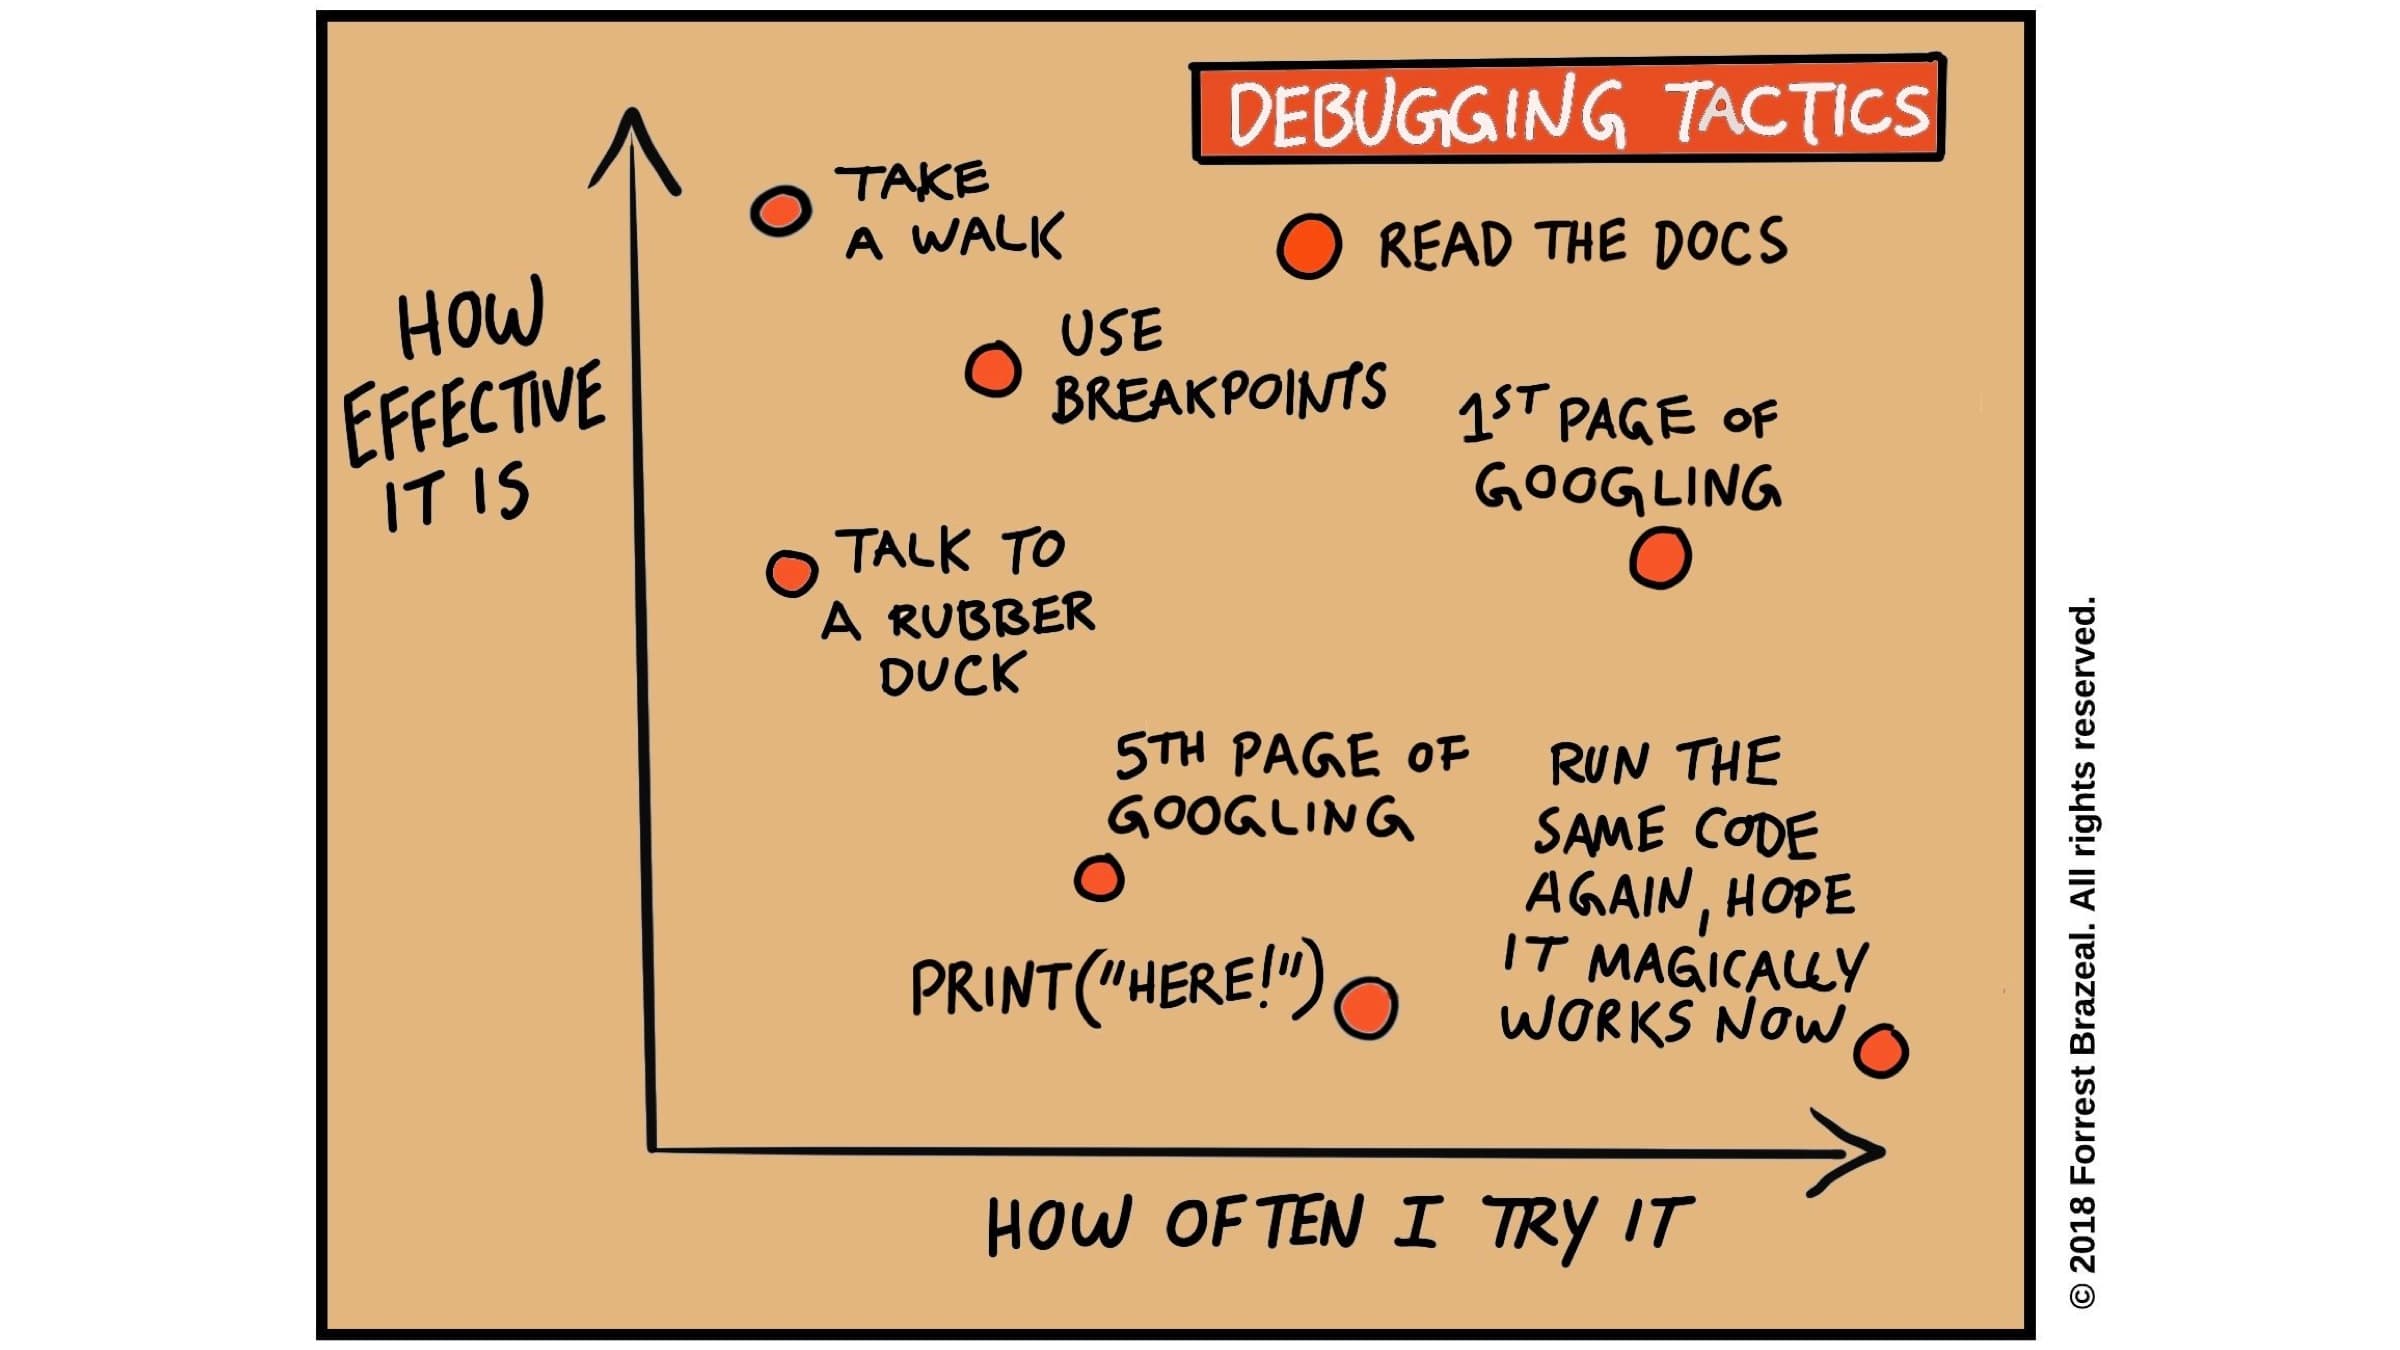
When you’re debugging a system, the first step is to accept that what you believe about how it works might not be true. If everything were as you believe it to be, then your code would work—but obviously that’s not always the case. If you can’t accept this, you might find yourself living the old saying 3 hours of debugging can save you 5 minutes of reading the docs.
 Illustration credit: Forrest Brazeal
There’s always going to be bugs in your code, and you need to know how to find them and fix them as quickly as possible. I’ll share a few (common) debugging techniques that have worked well for me.
Our stages of debugging usually look something like the following:
- That can’t happen
- That doesn’t happen on my machine
- That shouldn’t happen
- Why does that happen?
- Oh, I see.
- How did that ever work?
But, what specifically can you do to work through issues that are proving difficult to debug?
Take a walk
One of the best tools to debug code is walking away for 10-15 minutes
If you recognize that you are frustrated, stuck on a tricky problem, or running around in circles—take a break. A five to fifteen minute walk will help re-energize and reset your physiological state. You may return with new solutions!
Sometimes all we need is a little perspective to help us solve our problems.
Rubberducking
When you explain a problem to someone else, the important thing is not just who you’re speaking with but that in doing so, you are also explaining it to yourself.
When you teach someone else, you often find inconsistencies in your assumptions about the subject and are forced to take a new perspective.
As Kernighan and Pike would say:
Sometimes it takes no more than a few sentences, followed by an embarrassed “Never mind. I see what’s wrong. Sorry to bother you.”
You can talk to inanimate objects (like a rubber duck) if you find that easier than talking to another person.
The term “rubber ducking” refers to the act of explaining your problem, or “debugging” it, to a rubber duck before asking one of your co-workers for help.
Some developers, when asked for advice, say “Explain your problem to the duck first”—a good way of resolving many problems.
Leveraging AI (as an extension of Rubberducking)
Given the availability of ChatGPT, Bard and Claude, developers can of course leverage these tools as a rubberducking aid. Their effectiveness can depend on how much context they have of the problem you are focused on.
This can sometimes be worked around by providing the context window a summary of the problem and potentially some of the code related to it. You may find it more effective than a traditional rubberduck approach as these tools can “respond” to you and take part in a back/forth conversation.
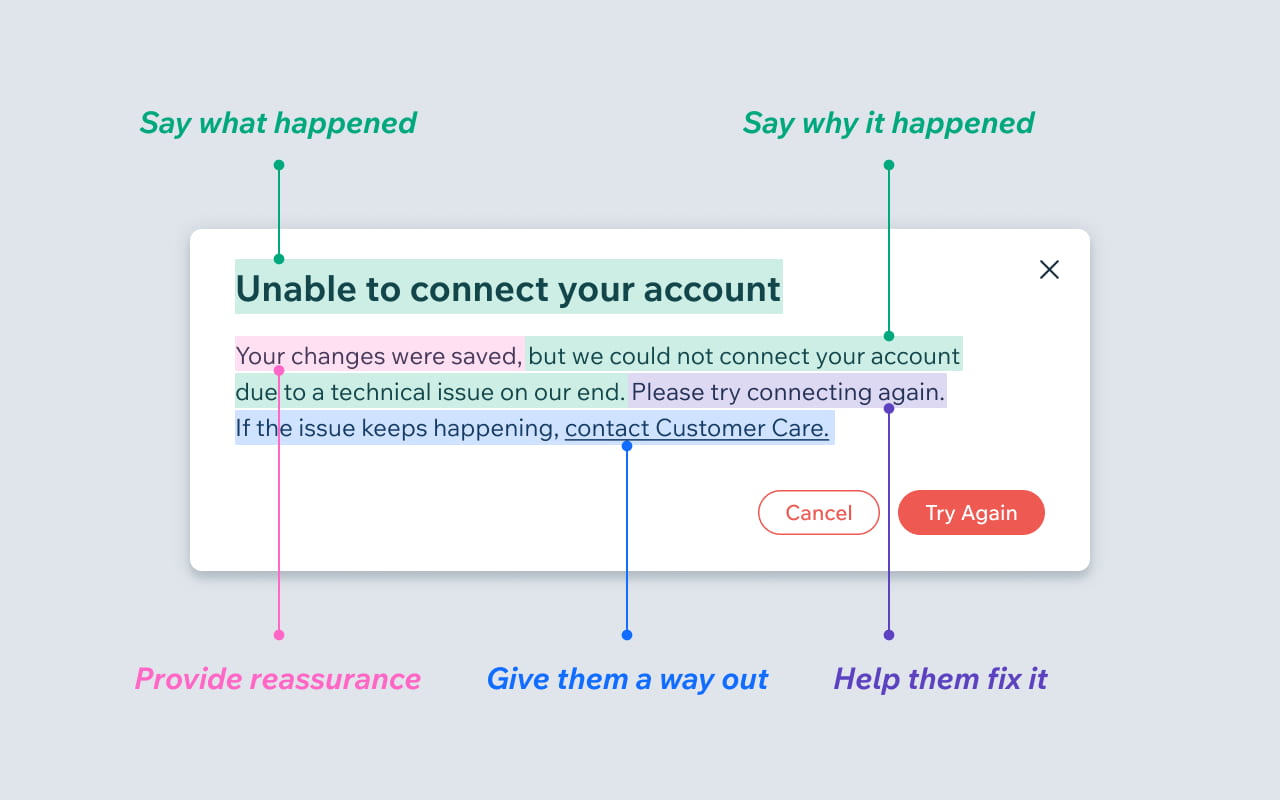
Actually read the error message
Something often overlooked when debugging is to read the error message. Your tools usually give you a lot of information about the problem, and it can be more helpful than you think.
Look for clues in the error message that might point to what’s wrong with your code. For example, if there are spelling mistakes in your variables or function names then fix them instead of assuming they’re bugs in your code!
There’s a lot that tooling authors can do to ensure that error messages are helpful:

Read the docs
Read the docs before trying to debug
This is an obvious one, but it’s often overlooked. I’ve seen people jump through all kinds of hoops in order to figure out why something they’re doing isn’t working, when all they had to do was read the documentation and realize that they were using a function or method incorrectly.
Read the docs as you are debugging
This is also fairly self-explanatory—if you’re stuck and don’t know where else to look for answers, try reading your code’s documentation again. Sometimes what seems like a bug will actually turn out to be a misunderstanding on your part (or maybe even an error in the documentation).
Read the docs after you have tried to debug
Just because it didn’t work doesn’t mean there isn’t something useful hidden away inside all those pages of text! Give yourself some time away from what was giving you trouble before coming back and taking another look at things with fresh eyes. You may come up with new ideas about how best to approach solving your problem once some time has passed since last looking at it closely.
Run the same code again
If you have a problem that is intermittent, then running the same code again may help diagnose the issue. This can be helpful if you are trying to diagnose:
- A timing issue
- Race condition
- Code with non-deterministic execution
- Code influenced by external factors like network latency
If you have a problem that does not seem to be intermittent but just fails once in a while, then it is best to run your code multiple times and check for differences between runs.
There are many tried and true approaches from “The Practice Of Programming” can help while trying to run the same code again:
Make the issue reproducible.
When you are debugging, start by making sure that the bug occurs every time under the same circumstances. Write a recipe that automates the steps you take to reproduce the problem.
One way to make it easy to reproduce a bug is by making sure that you can cause the error on demand, rather than having to figure out how or where the problem occurred.
Divide and conquer.
Can you create a smaller, more focused repro of code that triggers the same error as your original?
Identify the changes that eliminate the error, and test each change to see if it resolves or improves behavior.
Examine the numerology of failures.
Sometimes looking for a pattern in the numerology of successful and failing code diffs / commits can guide us toward what we’re seeking.
It’s possible a failure is due to a spelling mistake, a missing semicolon, or some other simple error.
1st page of Googling / StackOverflow
The 1st page of search results for an issue you’re debugging can be very helpful. You can often find other people who have run into the same problem and solved it, or at least have some ideas on how to approach the problem. It’s also a good idea to browse through the questions on StackOverflow related to your issue.
Logging
Developers often insert temporary logging statements (e.g. console.log(), print) in the code to check values during code execution. This is a good way to see if your code is behaving as expected. You can also use these statements to check the values of variables in between lines of code.
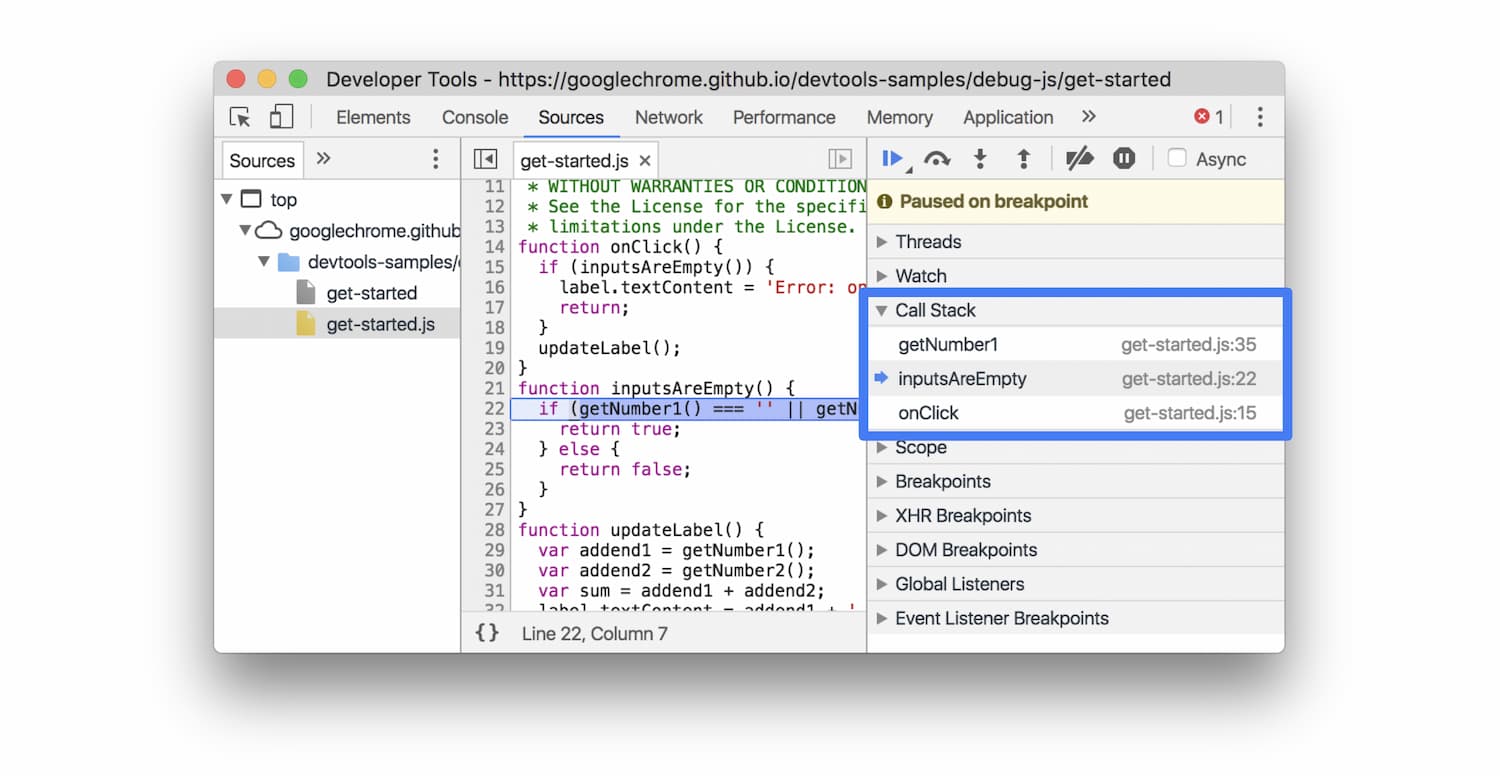
It may also be worth consulting stack traces - a list of the functions that were called to get to the place where your code crashed (or an error occurred). You can use a stack trace to help figure out what happened in your code, and sometimes how to fix it. Here’s the call stack in the Chrome DevTools debugger:

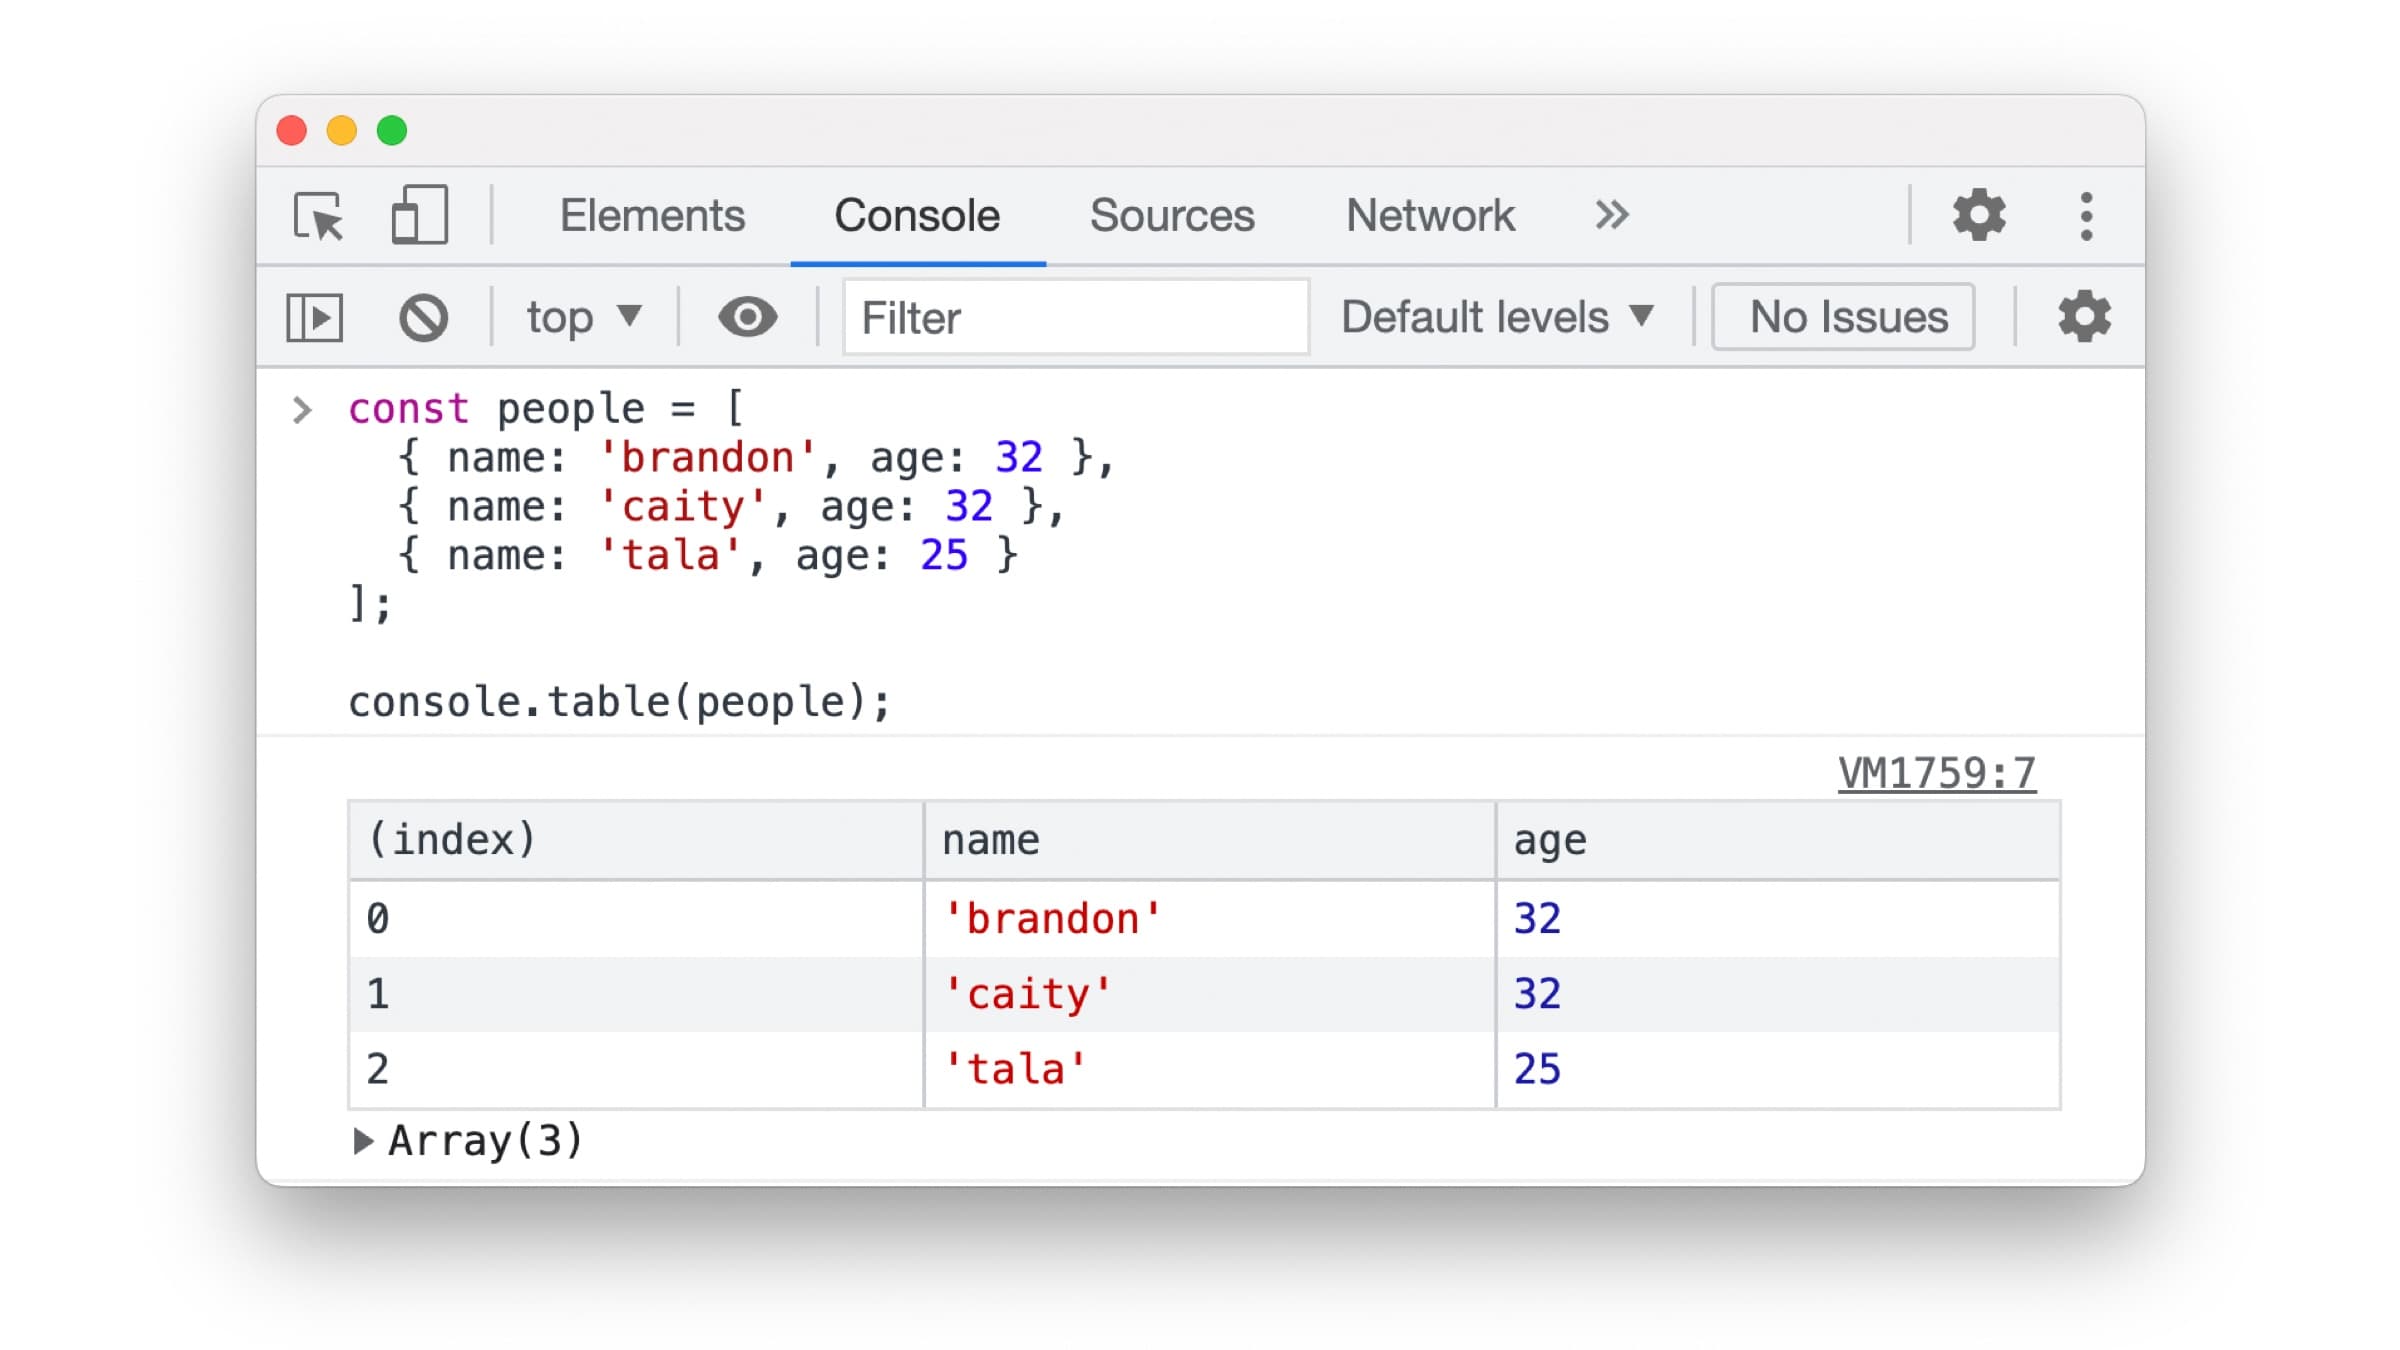
If you’re a web developer working with complex data structures, you might enjoy console.table() instead of console.log() for a much nicer visual representation of data:

Conclusion
There are may valid approaches to debugging code. The key is to use the process that works best for you and your particular project.
Ask the right questions and you’ll get to your goals faster.
To debug a problem, first define it and ask yourself questions about it.
- What is the goal of the code?
- What does the code actually do?
- What are the issues you found with the code?
- Have you encountered these kinds of issues before?
- What did you do to fix them last time?
- What do you think caused the bugs?
Asking these questions can often lead you to form at least a hunch about what might be causing the errors, which may then help in resolving them.