The History of Core Web Vitals
October 2, 2025
Core Web Vitals measure user experience by assessing a website’s performance. This write-up is a history of how Core Web Vitals came to be based on my recollections from our work on it at Google from 2014 onwards. The initiative saved Chrome users over 30,000 years waiting with businesses seeing revenue and user-engagement lifts through optimizing for it, inclusive of 2025.
Looking back at 2023, 2024 and 2025
Let’s start by reviewing the incredible progress we’ve all made together.
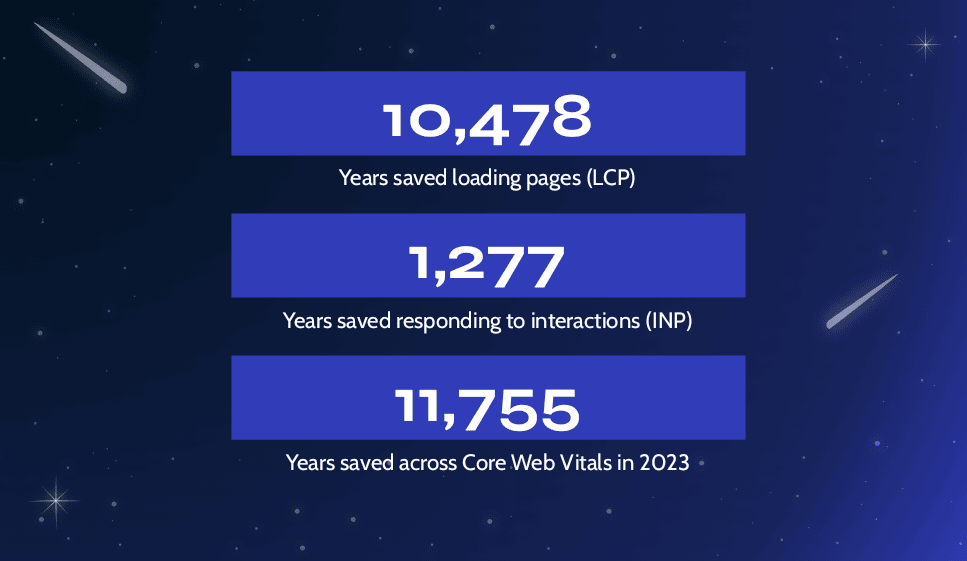
In 2023, the collective effort to optimize Chrome and websites across the ecosystem saved users a staggering 12,000 years of time, as measured by Core Web Vitals. Thanks to Annie Sullivan for her analysis showing this.
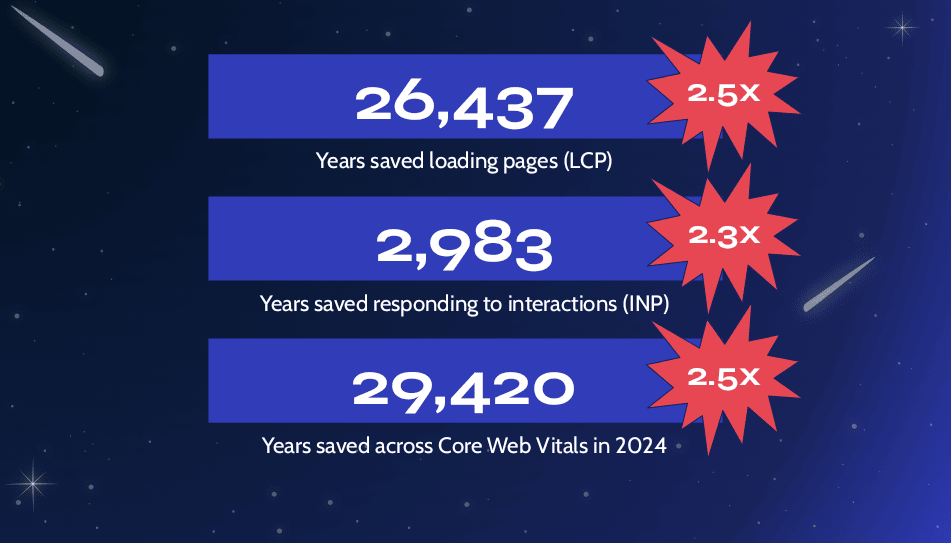
The momentum grew significantly in 2024, with that figure nearly tripling to an estimated 30,000 years saved. This massive impact translates directly into a better, faster, and more responsive web experience for millions of users around the globe every day.
2025 isn’t over yet, but as of September, the state of Core Web Vitals (data from CrUX) shows 53% of origins had good LCP, CLS and INP. Now let’s dive into the history behind Core Web Vitals to see how we got here.
Origins and motivation: from AMP to open web metrics
For years, Google emphasized speed and user experience as core principles of the web. Google’s Chrome team often repeated that “speed has been one of Chrome’s core principles since the beginning” yet many sites still delivered sluggish experiences[1].
In 2010, Google Search began using site speed [2] as a lightweight ranking signal on desktop, reflecting an early view that faster pages create better outcomes for users and businesses alike. The signal was intentionally modest, but it put performance on the map for SEO. Still, there were many aspects of web experiences that were slow, sluggish and didn’t provide an optimal user experience.
Around 2015, Google’s AMP (Accelerated Mobile Pages) project was introduced to tackle this by creating stripped-down, cached versions of pages for fast loading [3]. AMP could indeed make pages load faster, but it came with trade-offs: it was a walled garden of optimized HTML/CSS and served from Google’s cache, raising concerns about openness and flexibility. By the late 2010s, it became clear that a more standardized, open approach was needed - one that any site could adopt without special frameworks, and that could be recognized and even rewarded by platforms like Google Search.
In 2018, the performance stance broadened with the Speed Update, which applied page speed to mobile search rankings while reiterating that relevance still dominates [4]. Together these steps made clear that performance wasn’t an afterthought in Search - it was part of page quality. Ads moved in parallel. Google Ads introduced a mobile landing page speed score and factored mobile speed into ad systems, reinforcing that faster experiences convert better and should be rewarded. In other words, even outside of ranking blue links, Google’s ecosystem was already aligning incentives around real-world speed and user satisfaction.
Google’s desire to move away from the AMP-only approach culminated in an initiative to define open web performance metrics that could apply to any page. Internally, teams from Chrome and Search partnered to tackle this. They recognized that even if Google Search itself was fast, “the user experience would be subpar if the pages found were slow to load”[5]. By examining millions of pages, they set out to define a public standard for a fast, user-friendly web page[6]. These efforts led to the idea of “Core Web Vitals” – a set of unified, user-centric metrics that could gauge key aspects of page experience for any website. The goal was to have metrics that are field-measurable (i.e. reflect real users’ experiences) and that correlate with outcomes like user engagement. In short, Google wanted to empower the open web with the same performance focus that AMP had, but without requiring a special framework, and to reward sites that deliver great user experiences in an open-standard way. Core Web Vitals would build on years of work (including progressive metrics) thinking about the web’s performance challenges, but with a fresh focus on user-centric, real-world metrics that anyone could measure and improve.
Defining Core Web Vitals: three pillars of user experience
In May 2020, Google officially launched the Web Vitals initiative. This was announced on the Chromium Blog as “a new program… to provide unified guidance for quality signals that are essential to delivering a great user experience on the web.”[7] The first and most important of these were the Core Web Vitals – a shortlist of metrics focused on the core aspects of user experience that apply to all web pages[8]. In 2020, the Core Web Vitals consisted of three metrics, each capturing a critical dimension of performance:
-
Largest Contentful Paint (LCP) – a loading speed metric marking the point when the main content of the page has likely appeared. LCP identifies when the largest content element in the viewport (such as a hero image or headline text) is rendered, effectively measuring perceived load completion[9]. This was groundbreaking because it moved beyond earlier metrics like First Contentful Paint or onload, and focused on when the user actually sees meaningful content[10].
-
First Input Delay (FID) – an interactivity responsiveness metric that quantifies the delay between the user’s first interaction (e.g. a click or tap) and the browser’s response. FID captures the input lag experienced by users on first interaction, reflecting whether the page is readily interactive or bogged down by heavy scripts loading[11].
-
Cumulative Layout Shift (CLS) – a visual stability metric measuring how much the page’s layout moves around during load. It sums up the unexpected layout shifts that occur (with a focus on severity and frequency), so pages that cause elements to jump around (e.g. images without dimensions pushing text, or ads dynamically inserting) get a higher CLS score[12]. A low CLS means a more stable, pleasant viewing experience without the annoying “page jank” that can cause mis-clicks.
These metrics were chosen based on extensive research and experimentation we did on the team. Google’s user experience researchers and engineers (like interaction designer Amar Sagoo, engineer Annie Sullivan, and product manager Vivek Sekhar) dove into human - computer interaction studies to find the correlations between objective performance numbers and user perceptions[13][14]. They published “The Science Behind Web Vitals” in May 2020, explaining the rationale. For example, they noted that there isn’t one magic cutoff for “fast enough,” but multiple studies suggested keeping load times under about 2–3 seconds is critical to avoid user frustration[15][16]. Likewise, responses to user input should ideally happen within 100 ms to feel instantaneous and preserve the illusion of direct manipulation[17][18].
Similarly, any layout shift should be minimal; even a 0.25 CLS (where content moves noticeably) can degrade user experience, so the goal was set much lower. The Chrome team analyzed real user data to choose practical threshold targets for each metric that correlate with significantly better outcomes while still being attainable by a substantial slice of sites[19]. They recommended that sites aim for LCP under 2.5 s, FID under 100 ms, and CLS below 0.1 (measured at the 75th percentile of page loads)[20][21]. Hitting these “good” thresholds has a tangible impact: studies showed that pages meeting all the Core Web Vitals thresholds saw users 24% less likely to abandon the page mid-load, compared to pages that did not meet the thresholds[22]. In other words, if you can keep your load fast, your layout stable, and your input responsive, users are far more likely to stay engaged – a compelling argument for these metrics.
Crucially, Google made sure these metrics were standardized and open. Draft web specifications were published (e.g. for LCP, CLS, and a draft Event Timing API for FID) via the WICG and web perf standards groups[23]. Chrome (and other browsers) implemented these metrics in their engines, meaning any developer or analytics provider could measure them using the PerformanceObserver API.
To jump-start adoption, Google also released an open-source web-vitals JavaScript library in May 2020 that developers could drop into their sites to measure LCP, FID, and CLS for their real users[24]. This library, authored by Googlers like Phil Walton, handles the nuances of capturing the metrics accurately and even accounts for things like page backgrounding. It made it trivial for developers to send these metrics to Google Analytics or any other analytics backend for their own monitoring. At the same time, I built a Core Web Vitals extension for Chrome that would display the LCP, FID, and CLS in real-time as you browse a page[25] – useful for developers doing spot-checks in the browser. All of this reflected a broad effort to make these new metrics accessible and useful to everyone in the ecosystem, not just inside Google.
Page Experience: Core Web Vitals in Google Search rankings
Google’s Search team quickly embraced Core Web Vitals as part of a broader “Page Experience” update. On May 28, 2020, Google Search Central announced upcoming changes to include these metrics in ranking algorithms[26]. The rationale was straightforward: if two pages have similar content relevance, why not rank the one that offers a better user experience higher? The Page Experience signal would combine Core Web Vitals with other existing UX-related signals (mobile-friendliness, HTTPS security, and avoidance of intrusive interstitials) to create a more holistic ranking factor[27]. Importantly, Google made clear that great content still trumps all – page experience is one of many factors, and a fast site won’t outrank a more relevant site just because of speed. But in cases of ties or close calls, having good Web Vitals could be the tiebreaker[28][29].
Perhaps the most headline-grabbing part of this announcement was that once the page experience update went live, the Top Stories carousel on mobile would no longer be restricted to AMP pages[30][31]. Previously, Google News/Top Stories on mobile required AMP to be eligible; this requirement was to be lifted, making any page (AMP or not) with good page experience eligible. In other words, AMP was no longer the only path to great mobile SEO – an open web page that meets the Core Web Vitals and other page experience criteria could also be featured. Google explicitly stated: “AMP will no longer be necessary for stories to be featured in Top Stories on mobile; it will be open to any page”[32]. This was a pivotal shift, signaling Google’s confidence in these new metrics as a proxy for a good user experience, and its desire to encourage all sites to improve rather than funnel them into an AMP framework.
Google gave the ecosystem ample notice. Recognizing that 2020 was a tumultuous year (with the COVID-19 pandemic affecting many businesses’ priorities), they announced that the ranking change would not take effect until 2021, and promised at least 6 months’ warning[33]. True to that promise, in November 2020 they provided an update that the Page Experience ranking change would roll out starting in May 2021. Ultimately, the Page Experience Update began rolling out in mid-June 2021 and was fully live by the end of August 2021 (for mobile search)[34]. A similar update for desktop search followed in February–March 2022.
When the update landed, Google’s ranking algorithm started using Core Web Vitals as one of its hundreds of signals. Pages that met the “good” thresholds for all three CWV metrics were considered as having a good page experience. Google also created a Page Experience report in Google Search Console to help site owners see what percentage of their pages were passing the thresholds, using data from the Chrome UX Report (more on CrUX shortly)[35]. This way, webmasters and SEOs had direct feedback on how their site was faring in the eyes of the page experience signals.
It’s worth noting that Google flirted with the idea of surfacing a “badge” in search results for pages with good page experience (just as Chrome had considered badges in the browser UI). In the end, no permanent badge icon was added to Google’s search snippets – the reward mostly came in the form of ranking boosts rather than explicit labels. However, for a period Google did show a temporary “Page Experience” indicator in Search Console and even in search results experiments. The key takeaway was: Google was publicly incentivizing performance and UX. Achieving good Core Web Vitals would not only delight users but could also improve a page’s visibility in search. Google’s own documentation states that while the direct SEO ranking boost was relatively modest, “it is highly recommended for site owners to achieve good Core Web Vitals for success with Search”[36] – because it aligns with creating a better user experience which in turn correlates with users engaging more and bouncing less.
Tooling and Data: Chrome UX Report and performance measurement
To support this ecosystem shift, Google invested heavily in tooling and data for Web Vitals. A cornerstone of this effort is the Chrome UX Report (CrUX) – a public dataset of real-user experience metrics. In fact, CrUX had been around since 2017, collecting anonymized performance data from millions of Chrome users for millions of sites. When Core Web Vitals arrived, CrUX immediately started reporting LCP, FID, and CLS for all origin URLs in its dataset[37]. This made it possible for anyone to query field performance data. Google provided access via BigQuery and later via a CrUX API and CrUX Dashboard, so developers and SEOs could easily check how their site (or competitors) were doing on CWV metrics in the field. They even introduced a CrUX History API to obtain a time series of these metrics, enabling tracking progress over months[38][39].
On the developer tooling side, the integration was swift. By late 2020, most of Google’s performance tools had been updated to highlight Core Web Vitals. Lighthouse, the open-source auditing tool (used in Chrome DevTools and PageSpeed Insights), incorporated diagnostics and scoring around CWV. For example, Lighthouse added audits to flag “Largest Contentful Paint was X seconds (target <2.5s)” and suggestions to improve it, etc. Chrome DevTools added a Core Web Vitals pane and timeline markers so you could see LCP elements or layout shifts during page load. PageSpeed Insights (PSI), which traditionally gave lab scores, was overhauled to focus on CWV – it now prominently shows field data for LCP, FID (later INP), and CLS at the top, taken from CrUX[40][41]. Google Search Console, as mentioned, got a dedicated Core Web Vitals report that groups pages into “good”, “needs improvement”, “poor” buckets for each metric, helping site owners pinpoint trouble spots[35]. In short, a whole suite of tools was aligned to measure, monitor, and debug these new metrics. Much of the tooling work here was driven by Elizabeth Sweeny, Paul Irish, myself and others.
The web development community also rallied with third-party tools. Real User Monitoring (RUM) service providers quickly integrated Core Web Vitals into their offerings. For instance, Akamai’s mPulse added support for LCP, FID, CLS as first-class metrics right out of the box[42]; New Relic’s Browser agent and others like Dynatrace, Datadog, and SpeedCurve all did the same, so that companies could track these metrics on their real traffic. Even Cloudflare (which operates at the network edge) introduced a Browser Insights service that could collect Web Vitals by injecting a script[43]. The existence of the web-vitals JS library made it straightforward for any analytics tool to grab these metrics – some tools directly incorporated that library, while others wrote their own measurement code using the PerformanceObserver APIs. The result was that by 2021, Core Web Vitals became ubiquitous in the dashboards of web performance monitoring tools. This widespread availability helped spread awareness and gave developers the data to drive performance improvements.
The Chrome User Experience Report data was also vital for tracking progress of the web as a whole. Throughout 2021 and 2022, the percentage of traffic with “good” CWV steadily climbed, and this was often reported in the HTTP Archive’s annual Web Almanac or Google’s own blog updates. We’ll dive into the improvements shortly, but it’s clear that having measurable metrics that are publicly visible created a kind of virtuous competition – site owners and platform providers started bragging about their Core Web Vitals and striving to improve them, knowing both users and Google cared about these numbers.
Impact and Improvements: Making the Web Faster and more stable
Once Core Web Vitals were established, it triggered a massive, multi-pronged effort across the web ecosystem to improve these metrics. Google Chrome’s own engineering team took a hard look at the browser, finding ways to optimize how Chrome loads and renders web pages. Even small improvements at the browser level could benefit the entire web, given Chrome’s huge user base. Some key optimizations launched in Chrome over 2020–2023 include:
-
Prioritizing Content for LCP: Chrome made changes to prioritize loading of critical content. For example, Chrome enhanced how it discovers and loads images: it now identifies the first few images in the HTML (which often include the LCP image) and gives them higher network priority[44][45]. An internal experiment showed that prioritizing the first 5 images this way improved LCP on some pages from 3.1 s to 2.5 s, a significant win[44]. Similarly, new web standards like the fetchpriority attribute (a “Priority Hints” mechanism) were introduced, allowing developers to mark an image or iframe as high priority for LCP. Chrome implemented these hints to boost the loading of crucial resources.
-
Back/Forward Cache (BFCache): Chrome historically did not fully BFCache pages (a cache that allows instant back/forward navigation) due to technical complexities, but in recent years they enabled BFCache for many pages. By 2023, Chrome achieved a notable BFCache hit rate increase on both desktop and Android, meaning users going “back” to a page would see it instantly (zero LCP, zero input delay, since the page never unloads)[46][47]. Large platforms like Amazon reported benefiting from Chrome’s BFCache: Amazon saw a 22.7 percentage point increase in back/forward cache usage after Chrome’s improvements (from version M112)[48][49]. This translates to a smoother UX and effectively perfect CWV metrics for those navigations.
-
Prerendering (NoState Prefetch / Prerender2): Chrome launched a new prerenderer (called “Prerender2”) that allows the browser to fully load and render a page in the background, then instantly swap it in when the user navigates. Initially used for Google Search (prerendering the top result) and for typed URL predictions, this can cut LCP dramatically. In fact, Chrome reported that omnibox search prerendering yields a 500–700 ms (≈15–25%) median LCP improvement on those navigations[50]. Chrome is carefully rolling this out (to avoid mis-predictions or privacy issues), but it represents a step toward that ideal of “instant” page loads.
-
Optimizing Network and Scheduling: The Chrome team identified various small delays in input responsiveness and tackled them. For instance, they introduced a feature to Preconnect on pointer-down (when you start a tap/click, before you release) which shaves a few milliseconds off the connection setup for link navigations[51]. That yielded ~6–10 ms faster LCP on cross-origin navigations on average – seemingly tiny, but every improvement counts at scale[51]. They also improved how the browser’s main thread handles tasks when multiple tabs are open, to reduce contention. By adjusting task scheduling and using mechanisms like Windows 11’s EcoQOS for background tabs, Chrome was able to improve Interaction to Next Paint (INP) by ~5% and LCP by ~2% in heavily loaded scenarios[52]. These are incremental gains that add up across billions of page views.
-
Rendering and JavaScript engine improvements: Chrome’s RenderingNG architecture revamp (completed around 2021) made rendering more efficient. Specific tweaks like upgrading image loading priority (making sure LCP images aren’t blocked behind other less important tasks) and smarter garbage collection timing in V8 (to run during idle times) helped ensure smoother experiences[53][54]. In one case, Chrome developers found that the way cookies were accessed in a multi-process browser was causing jank – every document.cookie call had to synchronously fetch from a separate process. In a “Fast and the Curious” deep-dive, they described how they optimized Chrome’s cookie access by introducing a “shared memory versioning” for cookies, eliminating many redundant process hops[55][56]. This reduced input delays in cases where sites spammed cookie reads on every interaction. It’s a great example of low-level browser changes made in response to observing poor CWV (in this case, INP) in real-world traces.
All these optimizations in Chrome have made a measurable difference. By late 2023, Google reported that the average page load in Chrome was 166 ms faster than before Core Web Vitals existed[57]. That may sound small, but across the whole web it is huge: summing up the saved time, Chrome’s team calculated that in 2023 alone, speed improvements saved users over 10,000 years of cumulative waiting time for pages to load, and an additional 1,200+ years of waiting for pages to respond to input (thanks to interactivity improvements) [58]. In other words, the web literally got *years snappier for everyone. The share of traffic that meets the CWV “good” criteria also rose significantly.
When first announced, roughly 1/3 of page loads were good by CWV standards; by 2023, about 68% of desktop and 64% of mobile page visits** in Chrome met all three CWV thresholds[59][60]. That’s nearly a doubling of well-performing experiences.
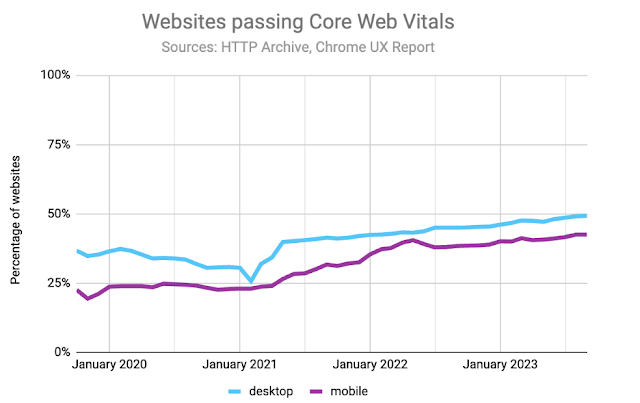
Websites passing Core Web Vitals over time (percentage of websites with “good” CWV scores for all three metrics). The blue line (desktop) and purple line (mobile) show steady improvement from 2020 to 2023, as measured by the HTTP Archive and Chrome UX Report.[61][62]
Improvements weren’t only on Google’s side. The broader web developer community, frameworks, and platform vendors stepped up to tackle performance issues identified by Core Web Vitals. A few notable examples:
-
Image Optimization and Lazy-Loading: Recognizing that images are often the largest content and a common LCP culprit, web frameworks and CMSes implemented smarter defaults. Native HTML loading=”lazy” for offscreen images was standardized (with help from Chrome and web standards contributors like Yoav Weiss and myself) and adopted in WordPress and other platforms, dramatically reducing unneeded image loading. WordPress enabled lazy-loading for images by default in 2020, then refined it to avoid lazy-loading the very first banner image (to ensure LCP isn’t delayed). Additionally, the new <img fetchpriority=”high”> attribute was quickly utilized by frameworks to mark the main image for faster loading. All these changes mean developers have better tools out-of-the-box to improve LCP.
-
WordPress Performance Team: Since WordPress powers roughly 40% of all websites, its performance has outsized impact. Initially, WordPress sites lagged in CWV scores – a 2021 report showed WordPress sites had a lower passing rate compared to some other ecosystems, which was a wake-up call[63]. The community responded by forming a dedicated Core Performance Team (with contributors from Google and other companies) to systematically improve WordPress core for speed. Their work has paid off in recent releases. For example, WordPress 6.3 (2023) included numerous optimizations to theme rendering and asset loading, resulting in core themes that “load 27% faster for block themes and 18% faster for classic themes, compared to WordPress 6.2, based on the LCP metric”[64][65]. In practical terms, millions of sites got faster just by upgrading WordPress. The WordPress team optimized their image handling, added caching for certain expensive operations, and made performance a priority equal to new features. As a result, the proportion of WordPress sites with good CWV scores has dramatically increased (some data showed the percentage of WP sites meeting all CWVs more than quadrupled from 2020 to 2022). This is a great example of an open-source community rallying in response to Core Web Vitals.
-
Wix and Website Builders: Other hosted website platforms like Wix, Squarespace, and Duda also treated Core Web Vitals as a rallying cry to improve their performance. Wix, for instance, undertook a major infrastructure revamp (caching, faster servers, better client-side code) and managed to increase the share of Wix sites hitting good CWV scores by several-fold. In a case study, Wix reported boosting the percentage of their sites with “good” CWV from about 4% to over 33% over the course of a year or so[66] – a testament to how a performance-focused culture shift in a company can benefit a huge number of users. Similarly, other builders like Duda often advertise that a large majority of their customers’ sites reach good CWV, in part because those platforms baked in best practices (like responsive images, CDN delivery, efficient templates). This competitive pressure meant that even if individual site owners weren’t performance experts, the platform they used was pushing improvements under the hood.
-
JavaScript Frameworks (Chrome Aurora): The Chrome Aurora team – a special task force within Chrome that partners with popular JavaScript frameworks – was launched in mid-2020 to help frameworks deliver better performance defaults. Members of Aurora (including Addy Osmani, Kara Erickson, Houssein Djirdeh, and others) worked closely with framework authors of React/Next.js, Angular, Nuxt, Gatsby, etc. to identify common bottlenecks and ship solutions. This collaboration yielded features like Next.js’s next/script component (which makes third-party scripts load more efficiently off the main thread), Angular’s built-in NgOptimizedImage directive (which automatically lazy-loads images and sets appropriate sizes and priorities), and Nuxt’s Google Fonts optimization module[67]. The impact has been significant: in 2022, the median Core Web Vitals scores for sites built with these frameworks improved noticeably. Google observed that Next.js sites’ CWV pass rate went from 20.4% to 27.3%, Angular from 7.6% to 13.2%, and Nuxt from 15.8% to 20.2% after these performance-focused releases and guidance[68]. And individual success stories abound – for example, an e-commerce site Land’s End saw a 40% improvement in LCP on mobile (in lab tests) after adopting Angular’s image optimizations, and CareerKarma saw a 24% LCP reduction by using Next.js’s improved script loading[69][70]. These are huge wins considering that developers often get them by simply upgrading their framework version.
-
Real-world Business Metrics: Ultimately, better Core Web Vitals aren’t just about appeasing Google – they correlate with real user satisfaction and business outcomes. Many companies shared case studies linking CWV improvements to user engagement. For instance, the news site Economic Times improved their INP (Interaction to Next Paint) by optimizing script handling, which led to a 42% increase in page views and 49% drop in bounce rate[71]. Travel booking site RedBus improved INP and saw a 7% increase in conversion rate[71]. And Meesho (an online marketplace in India) brought their LCP down from a sluggish 6.9 s to 2.5 s, yielding a ~17% reduction in bounce rate and 3% higher conversions[72]. These examples reinforce that performance isn’t just a technical metric – it translates to users sticking around, reading more, and buying more. Such success stories further motivated developers and product teams to prioritize Web Vitals.
The combined efforts of browser teams, framework authors, CMS developers, and countless individual web developers have dramatically improved the state of the web. By establishing clear, actionable metrics, Core Web Vitals created a common goal that everyone could rally behind.
Importantly, this was achieved without locking the ecosystem into proprietary technology – it leveraged open standards and data. As of 2023, roughly 40% of websites (and a much higher share of well-maintained, commercial sites) now pass all Core Web Vitals thresholds[73][74], whereas only a small minority did in early 2020. And even those that don’t fully pass have generally gotten faster and smoother than they used to be.
Equally crucial, a culture of performance awareness has spread: developers increasingly monitor their CWV metrics (surveys show about 51% of developers are actively tracking and optimizing for Web Vitals)[62]. Google also noted that despite pushing for these speed improvements, developer satisfaction with the web platform has remained high – indicating that the guidance was achievable without driving developers to despair[75]. This balance was important; had the CWV goals been impossible or the tools insufficient, developers might have rebelled, but instead the community coalesced around making the web better.
Evolving Metrics: INP, Soft Navigations, and Beyond
From the outset, Google acknowledged that Core Web Vitals would evolve over time. The set of three metrics in 2020 was not intended to be static or exhaustive[76]. There are other aspects of user experience (like smooth scrolling or long tasks later on the page) that weren’t initially covered. So, the Chrome Web Platform team continued researching new metrics and improvements to existing ones:
Interaction to Next Paint (INP): One clear gap in the original CWV was interactivity beyond the first click. FID measures only the first input delay, which is important for first impressions, but a page might become unresponsive later during more user interactions (e.g. clicking a button that triggers heavy JavaScript). To address this, Googlers like Annie Sullivan and Michal Mocny proposed INP – a metric that looks at all (or at least many) user interactions on a page and reports a kind of worst-case (or 98th percentile) delay. INP essentially asks, “When the user interacts with your page at any point, how long until the next frame is painted in response?” – capturing the latency of event handling and rendering. INP was rolled out as an experimental field metric in 2022 and gathered in CrUX.
By early 2023, Google found INP to be more predictive of overall responsiveness issues than FID. Thus, they announced that INP will replace FID as a Core Web Vital in March 2024[77][78]. This change was communicated to developers well in advance. Tools like Lighthouse and PageSpeed Insights started showing INP (and marking it “coming soon as a CWV”). Web.dev provided guidance on improving INP, which often boils down to the same practices as general performance: break up long tasks, use web workers for heavy computations, and so on. The shift from FID to INP underscores the CWV team’s philosophy of iterating on the metrics to better cover what matters – in this case, ensuring consistent responsiveness throughout the user’s visit, not just on page load.
Smoothness and Animation: Another aspect the Chrome team has looked into is visual smoothness, such as animation frame rates and scroll jank. While not an official CWV metric yet, there’s ongoing work here. The Chrome team has shipped the Smoothness metric in the RUM tooling (sometimes reported as “Jankiness” in CrUX) to quantify things like stuttering animations. They have also introduced APIs like the Event Timing API (to measure long taps or scroll delays) and even heuristics in the browser to reduce jank (for example, adjusting how touch events sync with display frames, which was detailed in an August 2023 Fast and Curious post about doubling the smoothness of Chrome’s own scrolling on Android[79][80]). We may see a formal “smoothness” Web Vital in the future, or possibly INP will be expanded to cover certain animation delays. The key is that Google is aware of these facets and actively experimenting.
Soft Navigations (SPAs): One limitation of the initial CWV definition was that it centered on full page loads (so-called “hard navigations”). However, modern Single-Page Applications (SPAs) often load once, then dynamically update content and routes without full reloads. These soft navigations (when clicking a link doesn’t do a full browser navigation but the content changes via JavaScript) were not captured by LCP or CLS measurements in the original implementation – from the browser’s perspective, it was still the same page, so a big DOM update didn’t trigger a new LCP. This meant that for SPAs, developers had to resort to custom measurement to evaluate their “page transitions” in-app, and the CrUX (field) data would also be blind to those subsequent navigations (only the initial page load CWV would be recorded). To fix this, Chrome proposed a Soft Navigation API. Shout out to Yoav Weiss for all of his work here. In mid-2023 Chrome began experimenting with detecting SPA navigations heuristically, and by mid-2025 launched an origin trial for the Soft Navigations API[81]. As described by Chrome engineers Barry Pollard and Michal Mocny, a soft navigation is when “JavaScript intercepts a navigation (e.g., via the History API or a framework router) and updates the content on the existing page, updating the URL via history.pushState without a full reload”[82]. The new API allows the browser (and developers) to mark these events and essentially treat them like new page views. Crucially, this enables measuring Core Web Vitals on SPAs as if a soft route change were a page load[83][84]. With the API, metrics like LCP can reset on a soft navigation and capture the largest content of the new view (using a concept called “interaction-to-next-paint” entries in the Performance Timeline)[85][86].
Similarly, CLS can be segmented per navigation, and INP can be associated with the current view. This is a big step toward bringing CWV to the world of client-side routed apps, which are extremely common. As of late 2025, the Soft Nav API is in trial; developers can opt-in and send feedback. Over time, we can expect Chrome to fully support soft nav metrics, and for the field data (CrUX) to incorporate them as well. This evolution acknowledges that user journeys consist of multiple steps, not just landing page loads, and the web platform needs to measure and optimize the whole journey.
Beyond these, Google has indicated they will continue to refine the metrics annually[76]. We may see adjustments like new thresholds (for example, if the web universally gets faster, maybe the “good” LCP target could become more strict than 2.5 s in the future), or entirely new metrics if a clear gap emerges.
Any additions go through a public process (definition in web perf standards, discussions with other browser vendors, etc.), as was the case with INP. Google also plans to incorporate more page experience signals over time – for instance, they’ve experimented with things like privacy and security (e.g. showing a “fast page” badge via Chrome if a site uses good practices).
In the Search ranking context, however, Google recently simplified the messaging: by 2023 they stated there won’t be an explicit “page experience” ranking booster beyond the individual signals. Essentially, they folded the page experience considerations into the core ranking algorithms more subtly. But from a site owner’s perspective, nothing changes – fast, responsive, stable pages remain fundamental to both user happiness and good SEO.
Acknowledgments and Contributors
The journey of Core Web Vitals was a massive cross-team effort, and it’s worth crediting the many people who made it happen. At Google Chrome, the Speed Metrics Team led the definition and implementation of these metrics – engineers like Annie Sullivan (who spearheaded metrics like CLS), Bryan McQuade , and Ilya Grigorik (who helped launch the Web Vitals initiative and authored the seminal Chromium blog post introducing it[76][87]). In my role as a Chrome engineering leader, I was fortunate to be deeply involved from the start – from our work with Search defining speed signals to Core Web Vitals to leading the Aurora framework [88] and WordPress Performance team’s partnerships and publishing many “Fast and Curious” updates quantifying progress[89]. On the Google Search side, Jeff Jose, Ofir Roval, Hillel Maoz and Malte Ubl played vital roles in getting the Page Experience signals off the ground. Also key was Sowmya Subramanian (Director of Engineering for Search Ecosystem) championed the page experience integration – she authored the May 2020 Search blog announcement[90] that set the course for CWV in rankings. Search outreach folks like John Mueller, Martin Splitt, and Danny Sullivan also played a role in communicating these changes to the SEO community, ensuring widespread awareness.
Several researchers and UX experts provided the scientific backbone – we mentioned Amar Sagoo for HCI research whose work informed some UX guidelines. On the developer relations and documentation front, Phillip Walton deserves huge credit for creating the web-vitals.js library and writing extensive guides on web.dev (including nuanced tips on optimizing FID/INP). Engineers like Barry Pollard, Katie Hempenius, and Jeremy Wagner produced docs and examples to educate developers on Web Vitals. The Chrome UX Report team, including Rick Viscomi and Johannes Henkel, built out the data pipeline that made field data accessible – without CrUX, site owners would have far less visibility into real-world CWV.
At Google, a number of Web Ecosystem Consults worked tirelessly with external businesses to help them improve their Core Web Vitals. Folks like Gilberto Cocchi, Melissa Mitchell, Swetha Gopalakrishnan, Cheney Tsai, Yuriko Hirota and many more provided hands-on advice and support to many developers, helping them understand and optimize their sites. Their outreach was crucial in driving adoption and improvement across the web.
In the wider community, countless framework and CMS authors stepped up. Next.js’s team at Vercel (led by Guillermo Rauch, with engineers like Tim Neutkens and Malte Ubl – who ironically was a lead on AMP before joining Vercel) embraced the push for performance by default. Nuxt’s creators (the Chopin brothers, etc.) likewise collaborated closely with Google. The Angular team (with folks like Minko Gechev and Alex Rickabaugh) integrated Aurora’s recommendations into the framework. On the CMS side, Felix Arntz, Pascal Birchler, Weston Ruter and Adam Silverstein at Google worked with the WordPress community, alongside leaders like Thierry Muller, to form the WordPress Performance team – a great example of open-source contributors and company-sponsored developers working together. Dan Shappir and the team at Wix engineered significant improvements in their platform and openly shared their strategies (e.g. at performance conferences and in a Smashing Magazine article). Many others in companies like Shopify, Drupal, Joomla, etc., took inspiration and made changes to improve Web Vitals in their ecosystems.
The web standards and performance working groups also contributed. Folks like Yoav Weiss (co-chair of WICG WebPerf, previously at Google, known for work on resource hints and responsive images) helped standardize things like LCP and Priority Hints. Nic Jansma (Microsoft/Akamai, co-chair of WebPerf WG) and Todd Reifsteck (Microsoft) collaborated so that these metrics would work across browsers (for instance, Firefox and Safari have implemented or are implementing many Web Vitals metrics as well).
Real-user monitoring vendors – e.g. Patrick Meenan (WebPageTest creator, now at Google) – integrated these metrics into tools early, amplifying their reach. And the HTTP Archive community (including Steve Souders, Henri Helvetica, Tim Kadlec, and others) made sure the progress (or lack thereof) on Web Vitals was tracked and reported, holding us all accountable.
In the later years of Core Web Vitals, many teams in Chrome continued to contribute to optimizing for them, including the Rendering team, Loading team, Catan team, V8 and many others.
Lastly, web developers around the world deserve credit. By responding to the Core Web Vitals initiative – learning the metrics, fixing issues, sharing tips – they validated Google’s gamble that an open, community-driven approach could work. The improvement in the global Web Vitals stats is really the sum of thousands of individual decisions by developers and site owners to optimize images, tame their JavaScript, and prioritize UX. It’s a virtuous cycle: as developers delivered more performant sites, users benefited with faster and smoother experiences, reinforcing the value of this work.
The history of Core Web Vitals is a story of the web platform rising to a challenge. It began with an insight – that user experience quality should be measurable and rewarded – and turned into a broad movement that touched metrics, browsers, search ranking, tools, frameworks, and hosting platforms.
Over a few short years, it has driven significant improvements in web performance across the board. And the journey continues: with upcoming innovations like measuring soft navigations for SPAs and continually refining metrics, the industry commitment to fast, delightful web experiences remains strong.
Core Web Vitals has proven to be not just a set of metrics, but a catalyst for a healthier, faster, and more user-centric web – a legacy built by the collaboration of many, and one that will benefit everyone who uses the web.[89][91]