Don't take fast hardware for granted.
There is a huge gap in CPU Performance between high-end vs. low-end phones
Source: Geekbench 5 CPU benchmark data
Table version
| Type | Single-core | Multi-core |
| iPhone 12 Pro | 1608 |
4338 |
| iPhone 12 | 1604 |
4277 |
| iPhone 11 Pro Max | 1335 |
3580 |
| iPhone XR | 1117 |
2192 |
| iPhone 8 Plus | 924 |
2080 |
| Samsung Galaxy S20 | 698 |
2377 |
| Samsung Galaxy S10 | 741 |
1957 |
| Samsung Galaxy S9+ | 505 |
2113 |
| Samsung Galaxy S8 | 365 |
1368 |
| Google Pixel 5 | 703 |
2346 |
| Google Pixel 4a | 711 |
2330 |
| Google Pixel 4 | 676 |
2227 |
| Google Pixel 3 XL | 498 |
1952 |
| Xiaomi Redmi Note 8 Pro | 499 |
1639 |
| Motorola Moto G power | 309 |
1364 |
| Samsung Galaxy A51 | 347 |
1239 |
| Samsung Galaxy A50 | 347 |
1222 |
| Oppo A5 | 305 |
1210 |
| OnePlus 8T+ | 412 |
955 |
| Samsung Galaxy S6 edge+ | 206 |
933 |
| Samsung Galaxy A10 | 209 |
508 |
| Motorola Moto G4 | 113 |
403 |
| Motorola Moto E4 | 80 |
297 |
Remember JavaScript execution is CPU bound. High-end devices process JS far quicker than those under $500.
This list includes U.S (Walmart) best-sellers such as the iPhone XR, Samsung Galaxy S10+ and Galaxy S20. Further included phones are popular in India, such as the Samsung Galaxy A51, iPhone 11, Samsung Galaxy S20 Plus and Redmi Note 8. It also includes phones like the Samsung Galaxy A50, Samsung Galaxy A10 and Oppo A5, more popular in LATAM, MEA and APAC.
There is a huge gap in CPU Performance between high-end vs. low-end laptops / desktops.
Source: Geekbench 5 CPU benchmark data
Compare an M1 MacBook to the competition.
Table version
| Type | Single-core | Multi-core |
| M1 MacBook Pro (13-inch Late 2020) | 1753 |
7693 |
| MacBook Pro (13-inch Mid 2019) | 1116 |
4063 |
| MacBook Pro (16-inch Late 2019) | 980 |
5991 |
| MacBook Pro (13-inch Mid 2018) | 918 |
3973 |
| HP ENVY x360 | 1222 |
5876 |
| Dell Inc. XPS 13 7390 2-in-1 | 1326 |
4830 |
| Microsoft Surface Pro 7 | 1240 |
4440 |
| Microsoft Surface Pro X | 763 |
2943 |
| Microsoft Surface Pro 6 | 609 |
2725 |
| Acer Chromebook 715 | 1015 |
3913 |
| HP Elite Dragonfly | 680 |
2595 |
| Lenovo IdeaPad S340 | 814 |
2842 |
| Lenovo IdeaPad L3 | 1008 |
1921 |
| Lenovo IdeaPad 1 | 477 |
1399 |
| Google Pixelbook Go | 734 |
1293 |
| Acer Aspire A515-43 | 404 |
1043 |
| HP Chromebook 11a | 264 |
907 |
| Acer Aspire A315 | 466 |
830 |
| ASUS TP401 | 458 |
816 |
| HP Stream 11 Pro G2 | 182 |
324 |
This includes devices popular with retailers like Walmart, laptops under $500, the Verge best laptops list and those anecdotally popular with developers.
In 2021, the global average selling price of phones is expected to reach $317
Global average selling price (ASP) of phones from 2016-2021
Source: Statista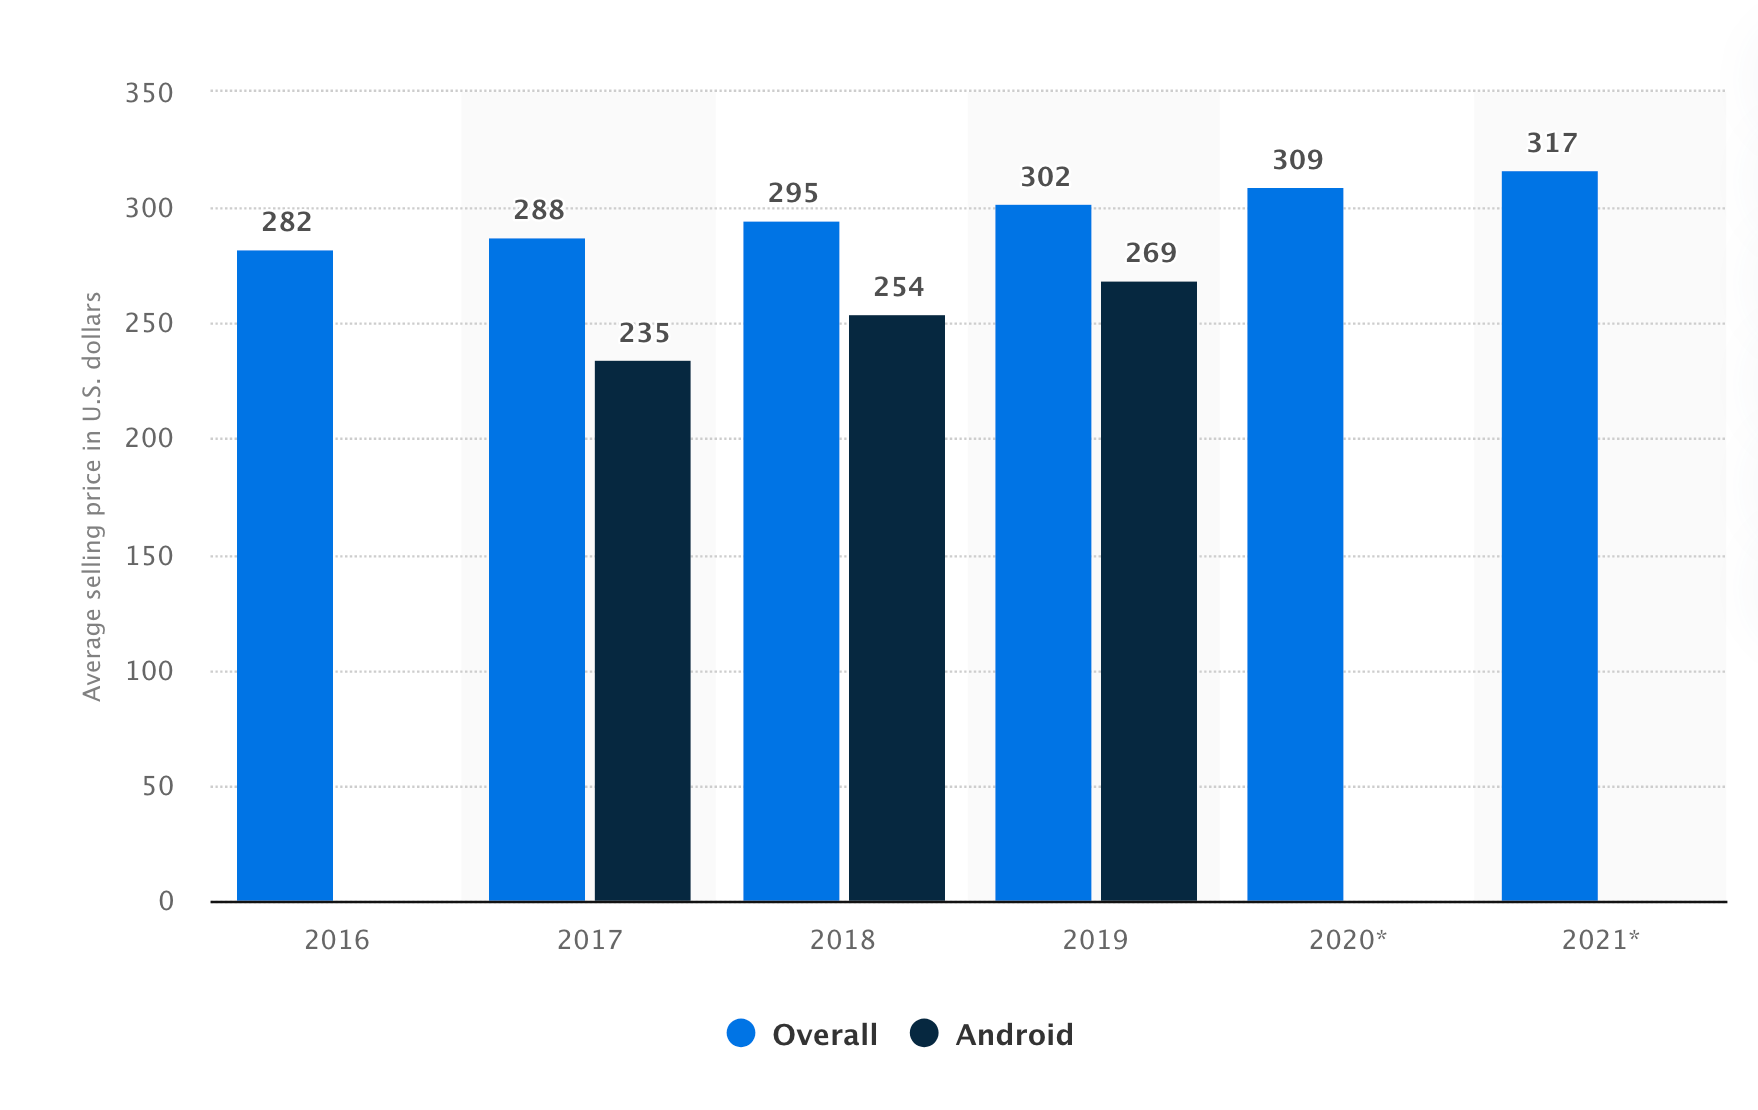
While the full-price of an iPhone 12 Pro is $999 and the Pixel 5 is $699.
Retail prices on Apple.com and the Google Store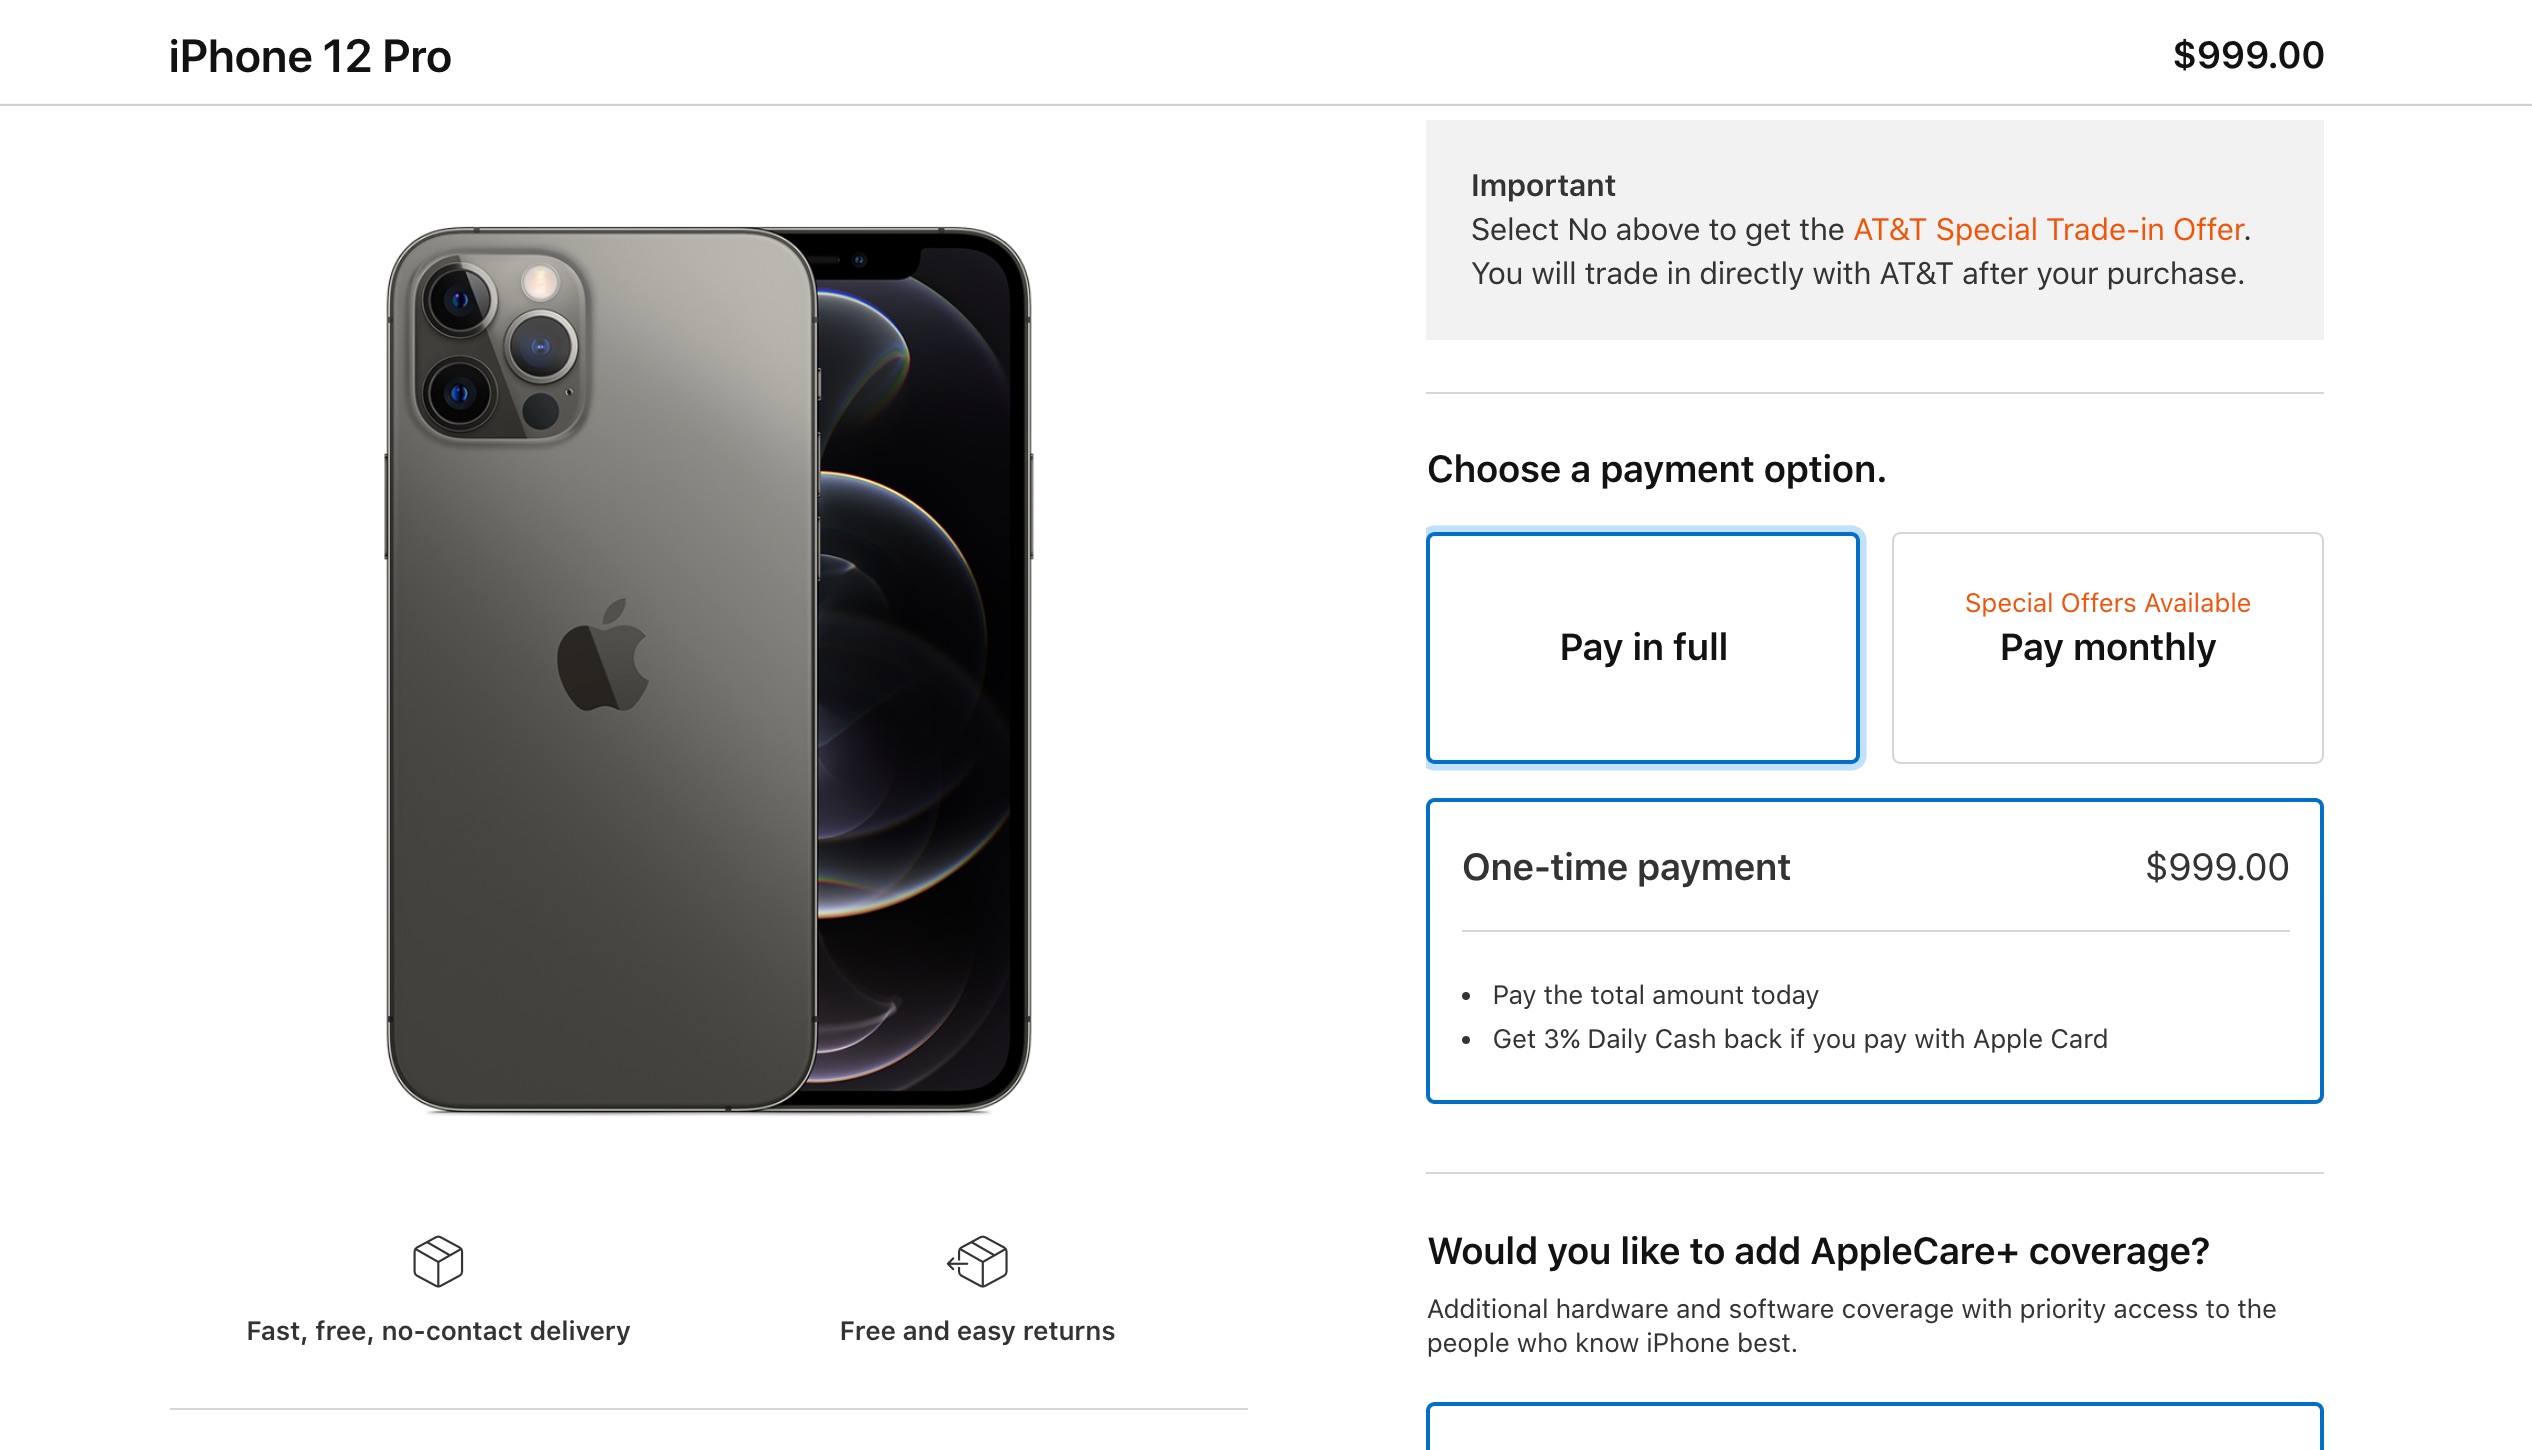
More information
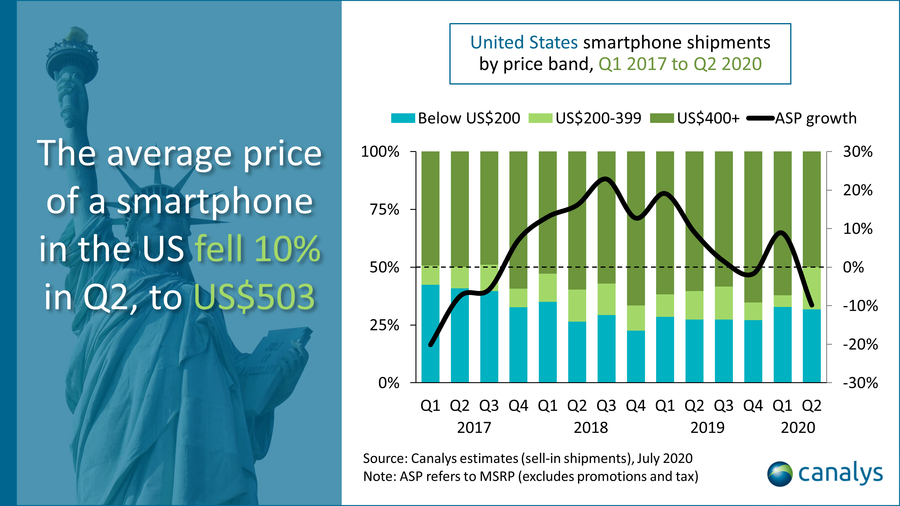
Global Smartphone Average Selling Price (ASP) was up 10% YoY
Source: Counterpointresearch
There are different brands offering different handsets to users in different economic circumstances. This means the price bands at which phones get sold can vary heavily globally. In Latin America for example, almost 60% of phones sold in 2019 had a price of $199 or less while 83% of phones shipped to Africa in late 2019 has a price tag of under $200.
As consumers increasingly want a better value proposition from their phones, the low and mid segments ($100-$200 and $200-$400) may remain the most popular.
Source: IDC
"Economic uncertainties have increased the downward pressure on smartphone prices globally with 73% of shipments in 2020 expected to be priced below $400, according to a new price band forecast from the International Data Corporation (IDC) Worldwide Quarterly Mobile Phone Tracker. - IDC"