Web Page Usability Matters
January 9, 2019
Users appreciate pages being usable and interactive soon after they're visually ready. UI interactions (scrolls, taps, clicks) can be delayed by script and other browser work so minimizing their impact can really help your users.
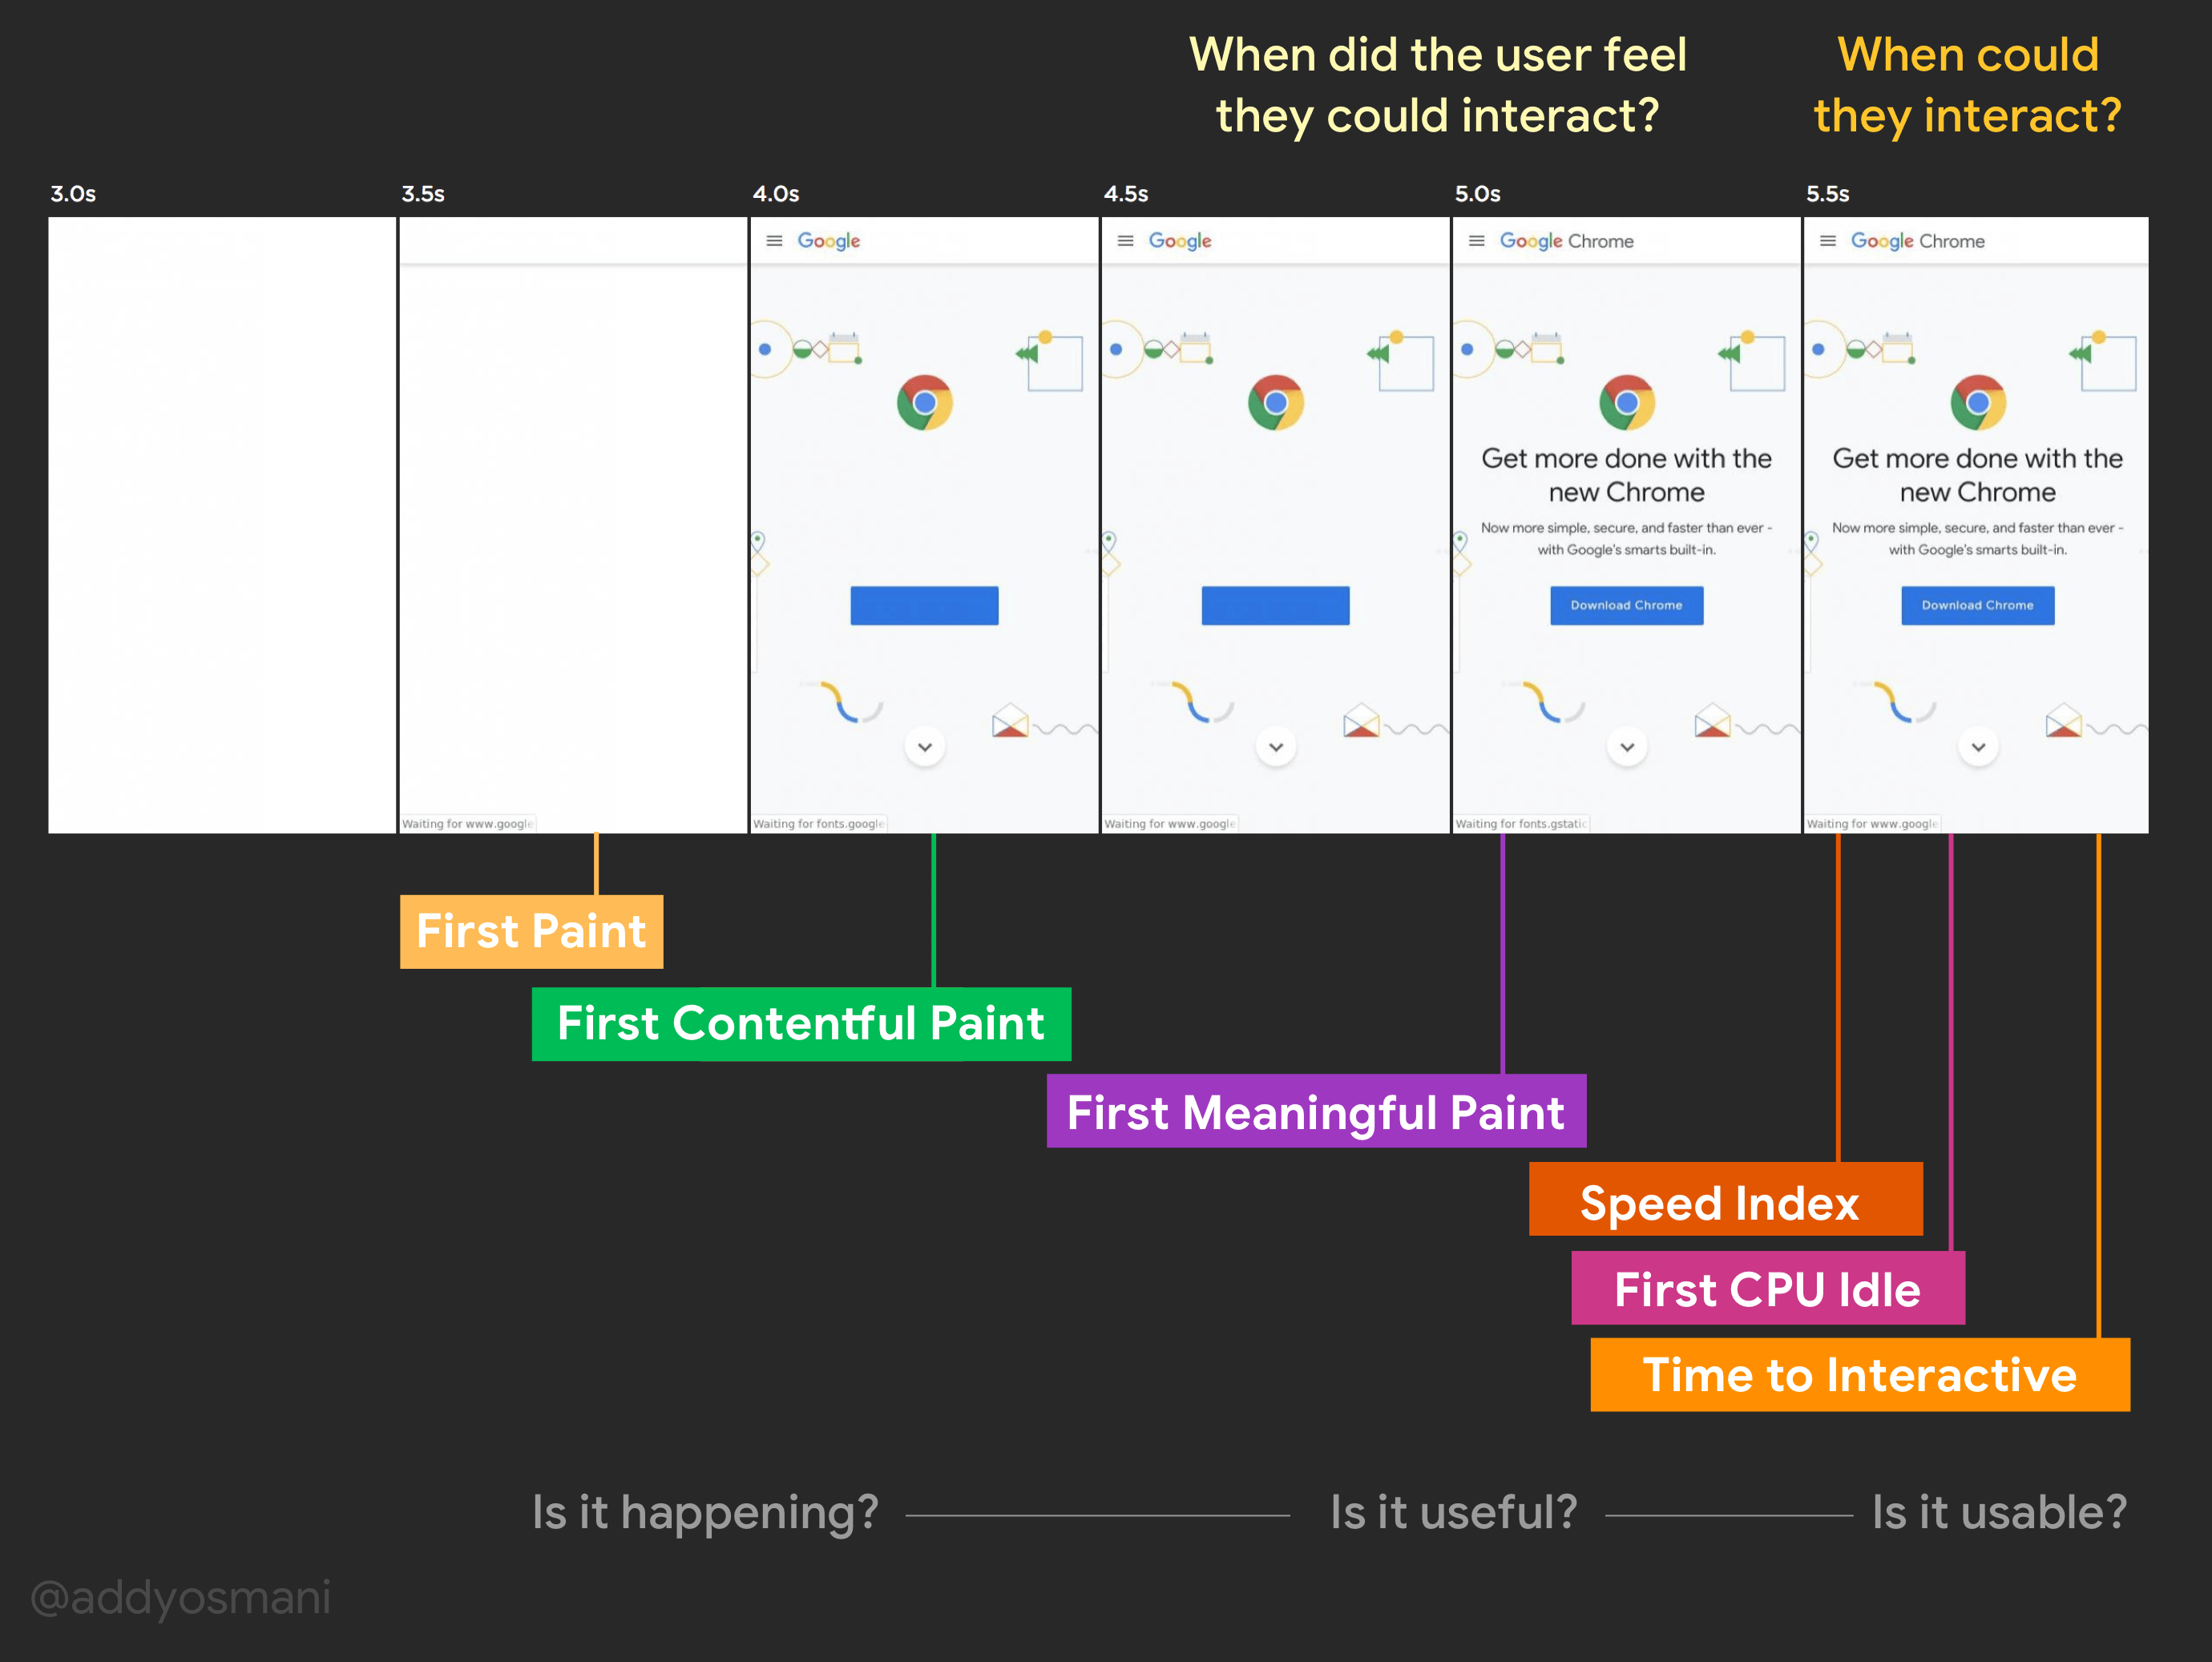
There isn't a single metric that fully captures the "loading experience" of a web page. Loading a page is a progressive journey with four key moments to it: is it happening? Is it useful? is it usable? and is it delightful?.

In terms of measurable metrics, these moments break down as follows:
- Is it happening?: Has the navigation started successfully? has the server started responding? Metric: First Paint
- Is it useful?: when you’ve painted text, an image or content that allows the user to derive value from the experience and engage with it. Metrics: First Contentful Paint, First Meaningful Paint, Speed Index (lab)
- Is it usable?: when a user can start meaningfully interacting with the experience and have something happen (e.g tapping on a button). This can be critical as users can get disappointed if they try using UI that looks ready but isn't. Metrics: Time to Interactive (lab), First CPU Idle, First Input Delay (field)
- Is it delightful?: delightfulness is about ensuring performance of the user experience remains consistent after page load. Can you smoothly scroll without janking? are animations smooth and running at 60fps? do other Long Tasks block any of these from happening?.

Page usability matters. Single-page Apps are unlikely to be usable (able to quickly respond to user input) if they haven't completed loading the JavaScript needed to attach event handlers for the experience or are hogging the browser's main thread (similar to above). This is a reason why monitoring usability metrics can be important.
Do users care about page usability?
Rage Click likelihood depends on the latency of page usability
In 2018, Akamai conducted a UX study into the impact of interactivity on Rage Clicks using mPulse. Rage Clicks happen when users rapid-click (or tap) on a site out of frustration. Akamai discovered that Rage Click likelihood depends on the latency of page usability:
- Rage Clicks are consistent if a user's first interaction is before the page becomes interactive (before interactive or
onload). This may be because event handlers are hogging CPU. - In 30%+ of cases, pages were interactive after
onloadfired and in 15%, users tried interacting sometime betweenonloadand interactive.

What is the optimum time to reduce Rage Clicking?

Akamai observed:
- The majority of users who Rage Click attempt to interact with a page between 1.25 and 1.5x the visually ready time.
- They suggested making sure your page is interactive and loaded before 1.3x the visually ready time.
For more on this study, see UX and performance metrics that matter by Philip Tellis.
Time to Interactive can have a high correlation with overall conversion rate
In a 2017 study, Akamai and Chrome found that across three real-world sites (in retail, travel and gaming) Time to Interactive had a high correlation with overall conversion rate. Conversions can be tapping a button to complete a purchase flow or any number of other types of responses to an interaction.
![]()
They discovered:
- Long Tasks directly delayed Time to Interactive.
- As first-page Long Task time increased, overall conversion rates decreased.
- Mobile devices could see a 12x Long Task time vs Desktop.
- Older devices could be spending half of their load-time on Long Tasks.
Note: This is an obviously small sample size and every site can be different.
The phases of loading in more detail
Is it happening? Is it useful?
When the user gets timely feedback that "It is happening" they feel much better, and they perceive the site as faster. At the same time, you don't want a user to render a page which is "useful" but which they cannot interact with because it isn't yet ready. This would leave them feeling it's not usable.

First Paint
First Paint marks when the browser can render anything visually different from what was dislayed before navigation. It confirms that rendering has started. This can be an important metric, as the duration of ‘blank screen’ is probably the most significant indicator of page abandonment.
First Contentful Paint
First Contentful Paint is when the browser renders the first content from the DOM - this could be article text, an image or SVG. The hope is this paint communicates a navigation successfully began.
Is it usable?
As I've covered in The Cost Of JavaScript, the web has a problem. Many sites are optimizing for content visibility but ignoring interactivity as their JavaScript for accomplishing this takes time to be processed. This means large numbers of very popular sites have multi-second delays between having painted something useful and being "usable" or interactive. During this time, the web feels slow and unresponsive.
Time to Interactive and First Input Delay

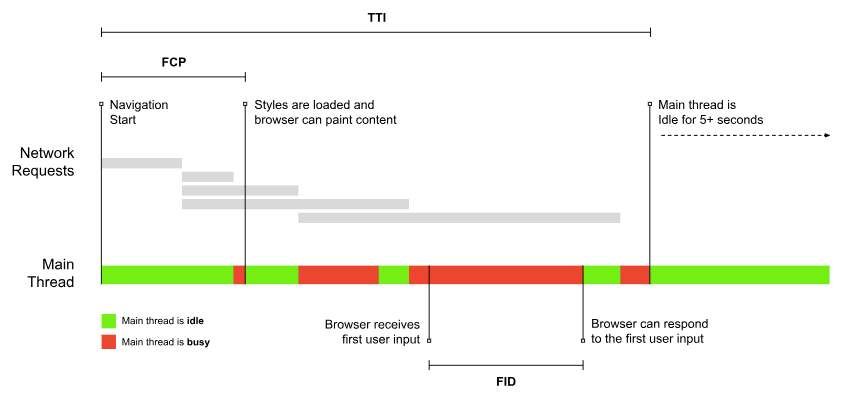
Time to Interactive (TTI) is a metric that measures how long it takes for a web page to become interactive. This is defined as a point when:
- The page has displayed useful content
- Event handlers are registered for most visible page elements
- When a user interacts with the page, the page consistently responds within 50ms - the user does not experience jank.
When a page has a great TTI, a user can tap around the interface with high confidence it will respond to input. This strictly meets the Idle guideline of the RAIL performance model: the page yields control back to the main thread at least once every 50ms. The network is idle. Specifically, there are only two open network requests remaining.
First Input Delay (FID) is TTI's complimentary metric in the field - it measures the time from a user first interacting with a page (e.g. tapping a button) to when the browser can actually respond to the interaction.
Optimizing user-centric metrics
A focus on optimizing user-centric metrics will ultimately improve the user experience. If you would like to reduce...
TTI or FID:
- Do less work
- Split up large JavaScript bundles using code-splitting
- Split up long tasks. Consider moving intensive off-main thread to workers.
- Postpone non-critical work until after page load
FP and FCP:
- Remove render blocking scripts from head
- Identify the critical CSS needed and inline in
<head> - App Shell pattern - improve user perception rendering UI skeleton
Monitoring metrics
Performance tools like PageSpeed Insights, WPT and Lighthouse capture user-centric loading metrics:

For CLI users, they are also available via pwmetrics by Paul Irish and Artem Denysov.
For monitoring metrics in the field (via RUM), I recommend the Paint Timing API which provides First Paint and First Contentful Paint. A polyfill for First Input Delay is also available. Paired with an analytics service these enable logging progressive web metrics for your real users.
The Chrome User Experience Report (also in PageSpeed Insights) provides access to some of these metrics (like First Contentful Paint and First Input Delay) for your real users using Chrome:

I also like SpeedCurve or Calibre for tracking metrics like FCP and TTI over time. It allows me to set performance budgets for them too which can help detect regressions:

Debugging metrics
Chrome DevTools now highlights performance metrics in the Performance panel. These can be found under Timings:

In addition to other surfaces these metrics are exposed, this can provide value while attempting to improve times in your iteration workflow.
References and learn more
- The Latest in Metrics & Measurement - Paul Irish
- User-centric Performance Metrics - Philip Walton
- Reliably Measuring Responsiveness In The Wild - Shubhie Panicker and Nick Jansma
- First Input Delay - Philip Walton
- First Input Delay - State Of The Web - Rick Viscomi
- Time to Interactive – focusing on the human-centric metrics - Radimir Bitsov
- Improve your web application using Progressive Web Metrics - Artem Denysov
- UX and performance metrics that matter - Philip Tellis
- Why Web Developers Need to Care about Interactivity - Philip Walton
- The Guide to Understanding Frustration Online
- First Input Delay: Correlation with TTI - Tim Dresser
- An Event Timing API - Tim Dresser and Nicolás Peña Moreno