DevTools: Visually Re-engineering CSS For Faster Paint Times
February 7, 2013
Increasingly, whether it’s on desktop or mobile, users want their web experience to be snappy and delightful. This means that even if the browser is busy rendering the page or loading in content, the user should still be able to scroll around and interact with it.
Animations need to be silky, scrolling must be buttery-smooth and your page needs to contain little to no jank. This comes down to offering an experience that can run at 60 frames per second even on regular pages, not just games and animations.
To hit 60fps, we sometimes need to go beyond JavaScript as the sole performance bottleneck for our pages and spend more time investigating paint and layout issues - styles might actually be the core cause of our sluggish performance. In this post, I’m going to talk about optimizing paint times for your pages.
Diagnosing slow paint times
Before we begin, let’s quickly recall what a paint is. In a browser's paint phase, the render tree (a tree of visual elements in the order in which they will be displayed) is traversed and a "paint" method called to display content to the screen. Painting can either be global (against the whole tree) or incremental (partial). The basic flow of a rendering engine can be seen below, taken from Tali Garsiel’s “How Browsers Work”.

Last year, Ilya Grigorik and the Jank Busters team at Google shared two pieces of advice to help us understand how to diagnose slow paint times in our sites and apps.
To discover what styles are slow, it was suggested we:
- Navigate to our page and open up the Chrome DevTools
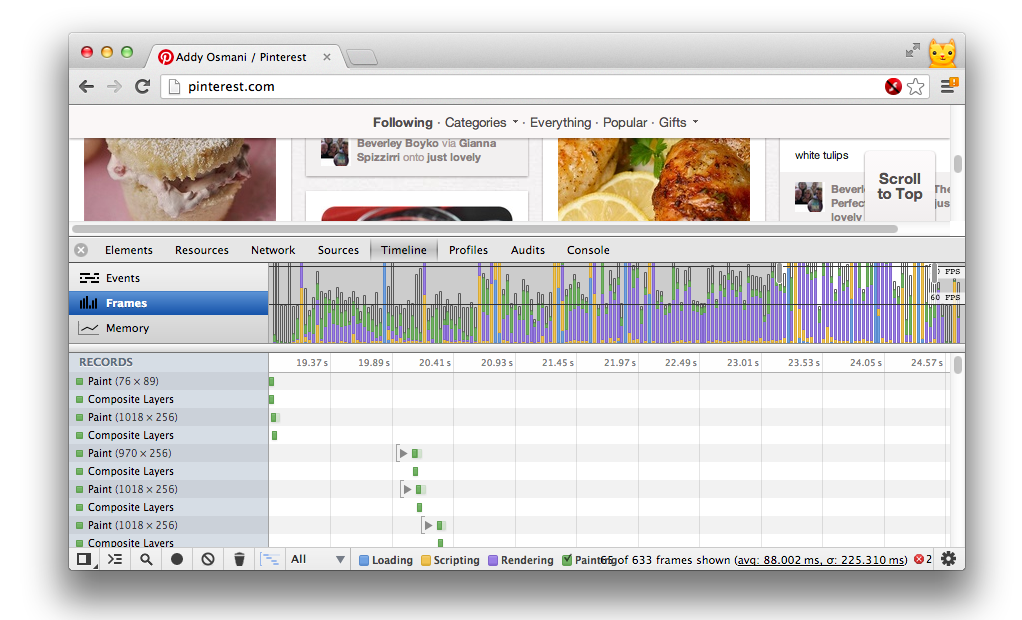
- Take a Timeline recording, noting the paint times
- Inspect individual elements - starting with the larger ones we’re suspicious might be slow
- Disable the styles for the element. You can remove an individual CSS style or a single style modification (if style is being set via your JavaScript)
- Repeat this process, checking if your paint times have gone down. If they have, you've found the culprit and styles can start to be added back.
- Alternatively you might want to play around with getting back the same visual style with different rules.
To establish what elements are slow, we used a similar process only rather than disabling styles, we set those parts of the DOM to display:none.
This process works fairly well, but we thankfully have some additional tooling we can use to help diagnose both paints and repaints.
What is a repaint?
During a user’s interaction with a page, only parts of it will be changed. For example, they may perform an action changing visibility or adding an outline to an element. The actual process of updating the screen is known as a repaint. Changes to your page (e.g JavaScript has modified CSS styles) invalidate the rectangle you see on the screen and cause your browser to view it as "damaged" (this is known as a damage rect).
A repaint is an expensive operation performance wise and can make your page look sluggish, which you ideally want to avoid. In WebKit, we keep an eye on what in the screen needs to be changed, creating a damage rectangle with the coordinates to parts of the page requiring repainting.
We save the old rectangle, prior to your changes, as a bitmap and then only paint the delta between the new rectangle and the old one. If you notice that there are particular areas of a page that require a lot of repainting, it’s useful to investigate what can be done to reduce the painting cost.
Reducing repaints - an updated Timeline workflow
Before we explore an updated workflow for reducing repaints and jank, let’s first look at a new shortcut that was introduced to help with this.
Pro-tip: we have a shortcut for quickly hiding DOM elements
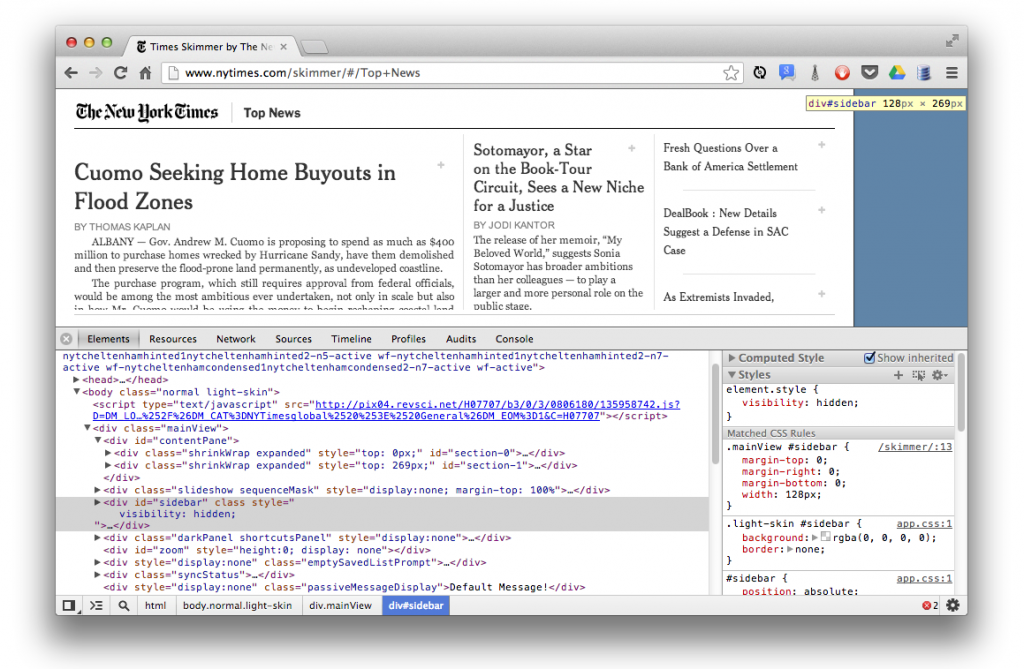
We recently added helper to the DevTools (Canary) allowing you to easily toggle setting visibility:hidden on an element. When this style is applied to an element, it isn’t painted but does maintain the page layout in an unchanged state.
To use the shortcut, select a DOM element in the Elements panel and then press the H key. When paired with paint rectangles and the Timeline, you can easily evaluate which DOM elements are spending long on paint time.
Workflow
Let’s now look at what an expanded workflow for diagnosing paint and jank issues might look like:
- Open up your page, launch the DevTools and switch to the Timeline panel. Hit record and interact with your page the same way your user would.
- Check the Timeline for any frames that went over budget (i.e that are below that ideal 60fps). If you’re close to the budget, then you’re likely way over budget on mobile. Aim to complete all of your work within 10ms to have some margin. Note: This margin is for slower devices and you should almost certainly run this analysis on mobile using remote debugging (if building for mobile, which you should be!).
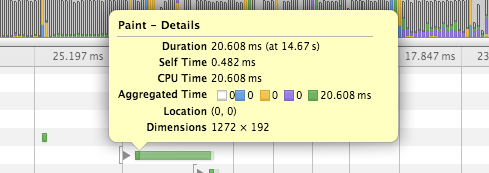
- Once you’ve noticed you have a janky frame, check what the cause of it was. Was it a huge paint? CSS layout issue? JavaScript
- Fix the problem. If it was a paint or layout issue:
- Hide anything non-essential to your page. Inspect these elements in the Elements panel and then use the hide (H) shortcut to hide them
- Walk through the DOM tree, hiding different elements using the hide shortcut. You might discover hiding particular element(s) make a large difference to your frame rate.
- We now know there is something about an element slowing painting down. Uncheck styles that could have an impact on paint time (e.g box-shadow) for the element and check your frame rate again.
- Continue until you’ve located the style responsible for the slow-down.
- Rinse and repeat
Especially on sites that rely heavily on scroll, you might discover that your main content is relying on overflow:scroll. This is a real challenge as this scrolling isn’t GPU accelerated in any way so the content is repainted whenever your user scrolls. You can work around such issues using normal page scroll (overflow:visible) and position:fixed.
Additional Tools
Show paint rectangles
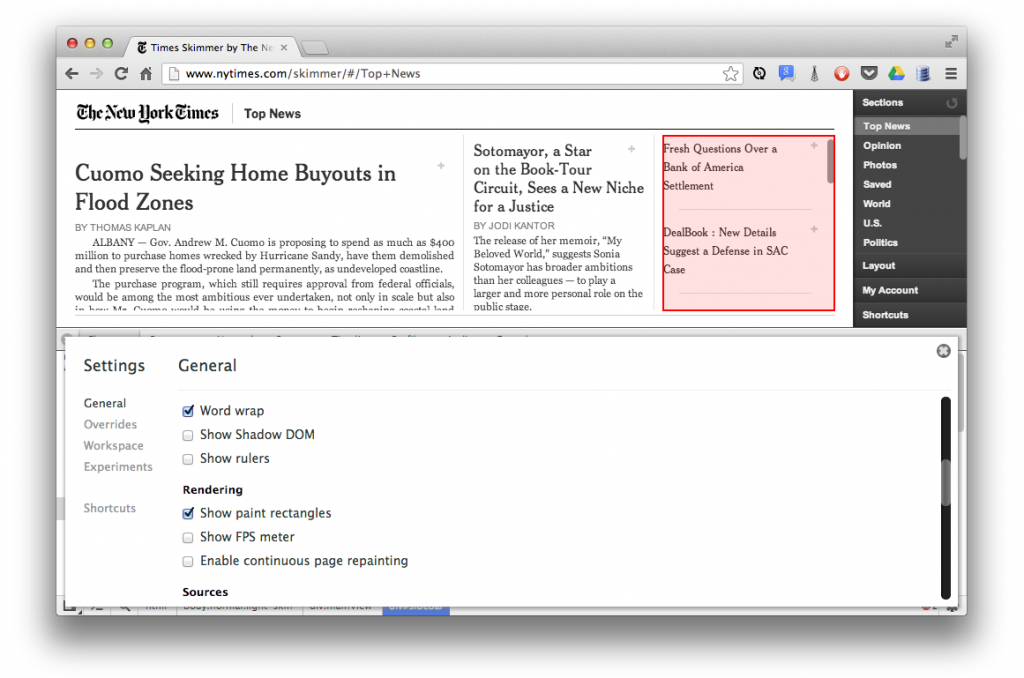
Under ‘Rendering’ in the Settings cog, you can enable a feature called ‘Show paint rectangles’ to help you visually see the area repainted in each frame. With this feature enabled, it can become easy to visualize what slows pages down. You want to keep the areas being repainted as small as possible.
FPS counter
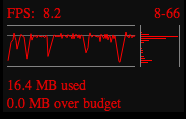
An older, but equally as useful tool for visualizing frame rate and jank is the real-time FPS counter. This can be enabled in the DevTools by going to the Settings menu and checking Show FPS meter.
When activated, you will see a dark box in the top-right corner of your page with frame statistics. The counter can be used during live editing to diagnose what in your page is causing a drop-off in frame rate without having to switch back and forth with the Timeline view.
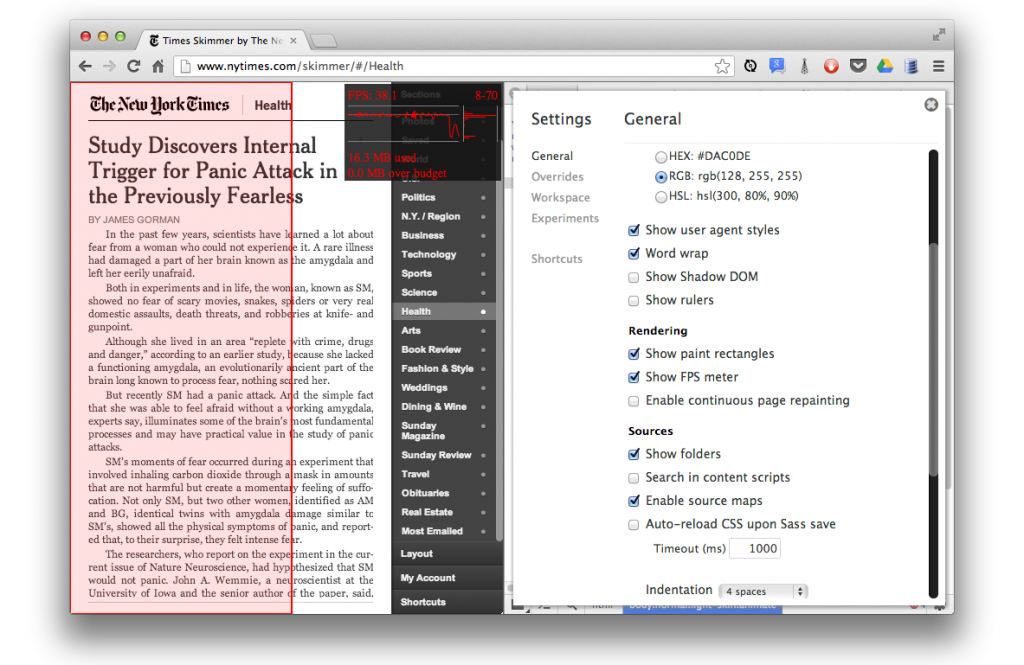
Keep in mind that just tracking the FPS counter may lead to you not noticing frames with intermittent jank. Be careful when using the content. It is also worth noting that FPS on desktop does not equal FPS on devices and special care should be taken to profile the performance there too.
Additional notes
- Tools to force constant repainting are currently under works and should be available to all sometime soon. Keep an eye out on the Chromium blog for when this is available!
- Some of the tooling recommended in this post works under the assumption that impl-side painting is not active in the version of Chrome you are using. This is currently not the case for Chrome beta for Android. Whilst we anticipate a solution to ensure tools continue to work with impl-side painting, it’s useful to keep this point in mind for the future.
Conclusions
Sometimes it’s the small, seemingly insignificant things that can be the greatest performance bottlenecks in your application. Watch your CSS and also keep in mind that it’s quite plausible to have poor paint times due to non-optimal JS, such as onscroll handlers firing multiple times or occupying a great deal of time.
Whilst I don’t suggest you purely focus on paint or layout, it is useful to be aware of the cost of using certain styles in the wrong way. I hope at least some of this comes in useful. Happy profiling!
