DevTools Extensions For Web App Developers
March 26, 2013
The past year has seen many leaps made to improve developer productivity through better tooling. We're paying increasing attention to our workflow and many of us have spent time optimising our usage of tools like Grunt, Bower, Yeoman and the terminal.
Another important area worth spending time on is your debugging workflow - if you're like me, this starts with the Chrome DevTools. When building an application with a specific framework or language abstraction, there's actually some additional tooling available to you in the form of recent DevTools extensions.
In this post, I'll share a quick summary of the latest developments in this area, ranging from the recent Ember extension Yehuda Katz presented at EmberCamp through to less well known extensions for Backbone and KnockoutJS developers.
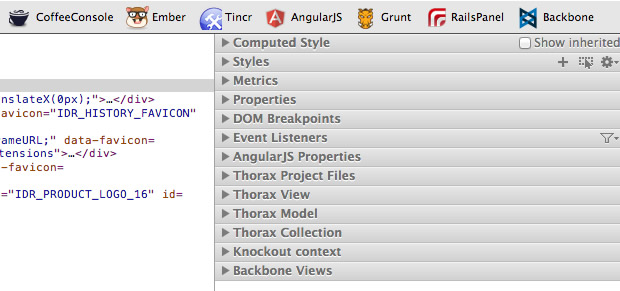
Note: Canary DevTools disables icons in the toolbar by default, but I've re-enabled them via the Settings cog to aid with visualisation.
Ember Inspector
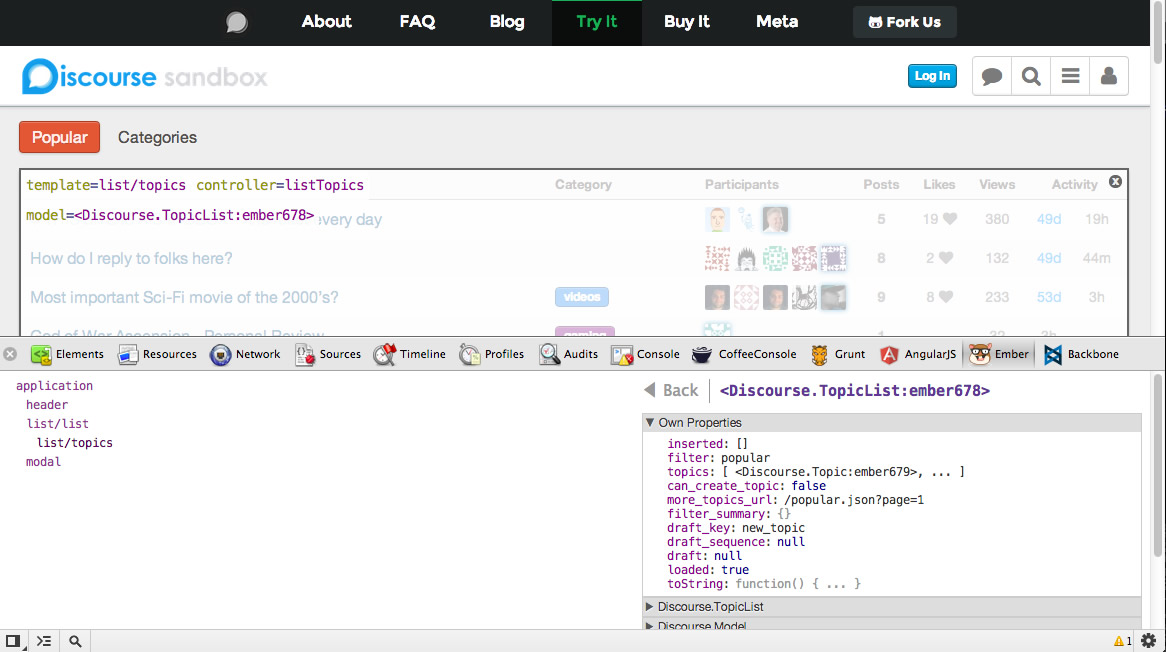
Improve your Ember.js debugging workflow with easy inspection of controllers (just select an element rendered within a context for more information), get insights into models and their attributes, layers, bound computed properties and avoid the need to dig down into the Ember object graph to figure out what is going on.
- Released as a preview on GitHub.
- Install via
git clone git://github.com/tildeio/ember-extension.git - Screencasts from Yehuda Katz
- Additional tooling: Ember Tools
Backbone DevTools
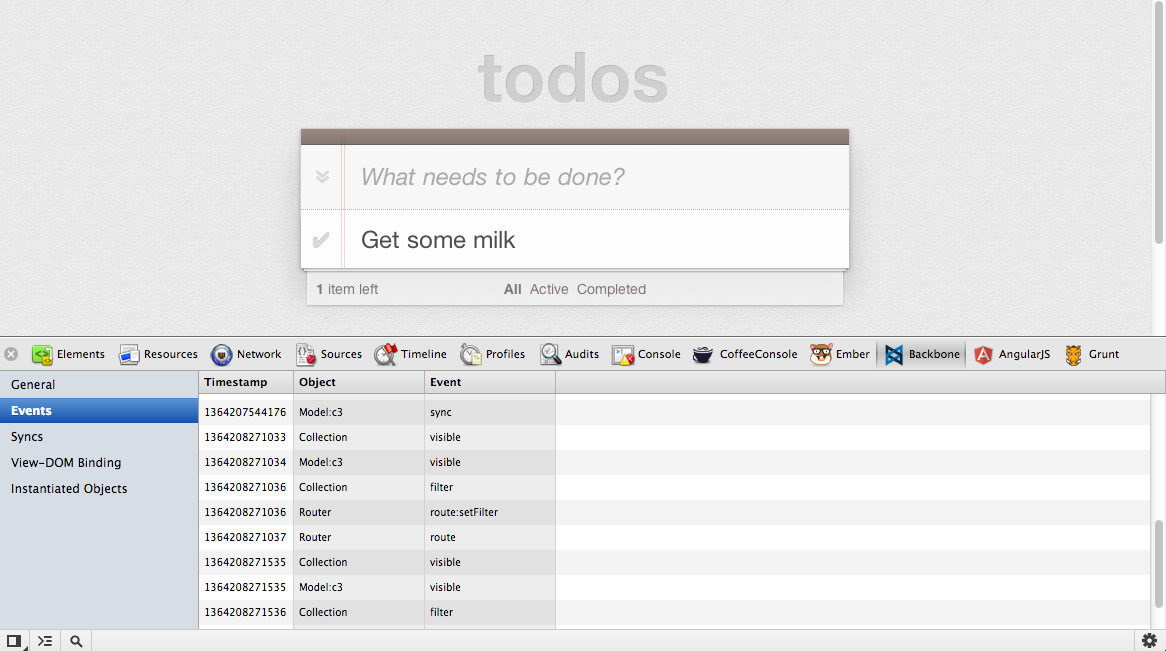
As Backbone.js aims to provide a minimalist baseline for structuring apps, there hasn't been a huge amount of work done on it's tooling in the browser, but this extension for it is pretty neat. Inspect events, syncs, View-DOM bindings and what objects have been instantiated. A useful View hierarchy displayed in the Elements panel and you can also inspect a DOM element and the closest View will be exposed via $view in the console.
- Released as a preview on GitHub.
- Install via
git clone git://github.com/spect88/backbone-devtools.git - Additional tooling: Grunt-BBB
Angular Batarang
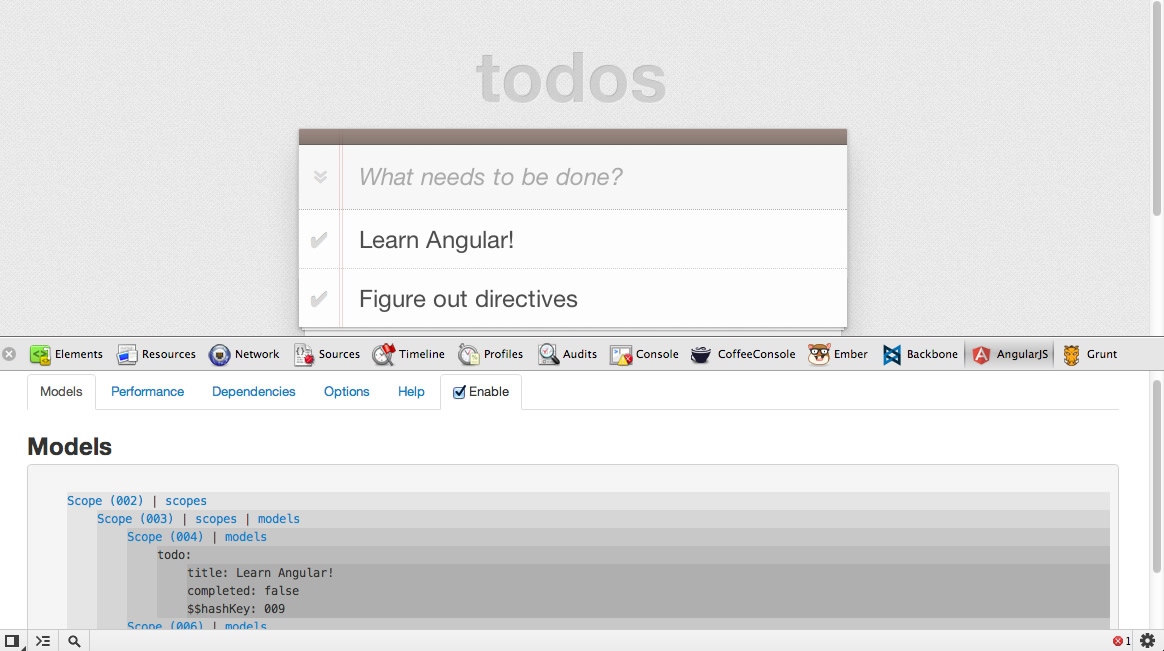
Perhaps the most mature of the extensions listed so far, the Angular team have poured a lot of time and love into Batarang. $scope can get tricky so it's helpful that it helps you inspect nested scopes, view DOM elements associated with a scope, get insights into models - selecting a scope switches to the Elements pane, analyse performance of an app's expressions and visualise dependencies.
- Released as a stable extension on GitHub.
- Install via Chrome Web Store or
git clone git://github.com/angular/angularjs-batarang - Screencast from Brian Ford
- Additional tooling: Yeoman
Thorax Inspector
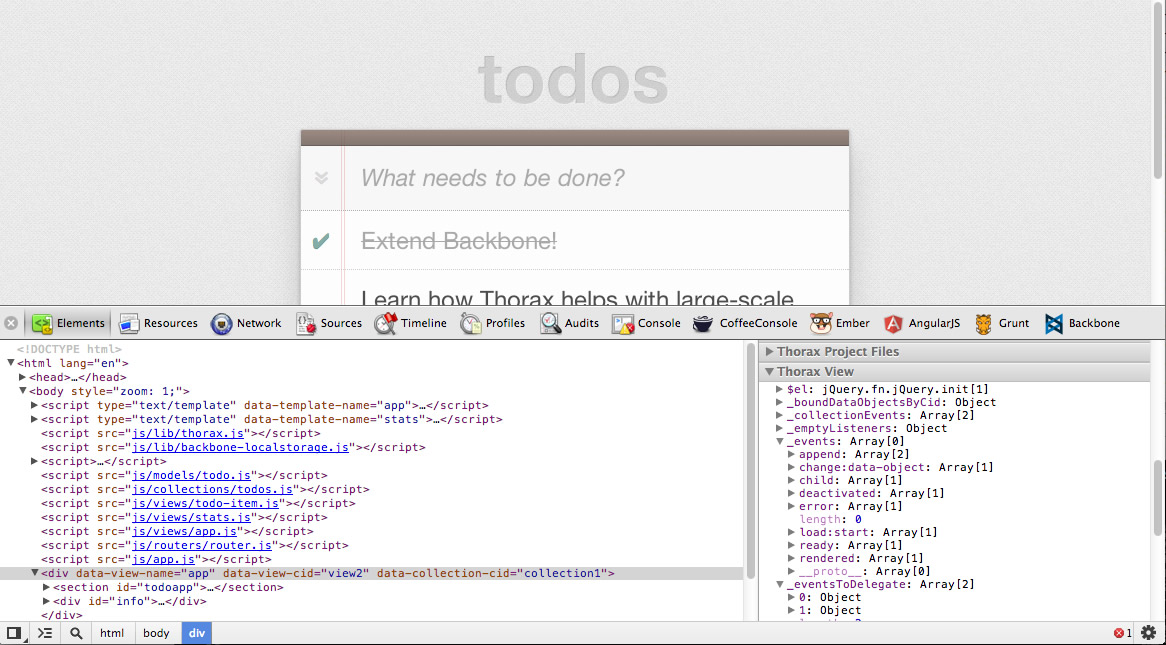
Currently the only DevTools tooling for a Backbone extension library, this tool lets you inspect Thorax projects, Views, Models and Collections via the Elements panel. There's some special setup work required to get it recognizing Thorax projects so make sure to checkout the readme.
- Released as a preview on GitHub
- Install via Chrome Web Store or
git clone git://github.com/eastridge/thorax-inspector.git - Additional tooling: Thorax-seed
KnockoutJS Context
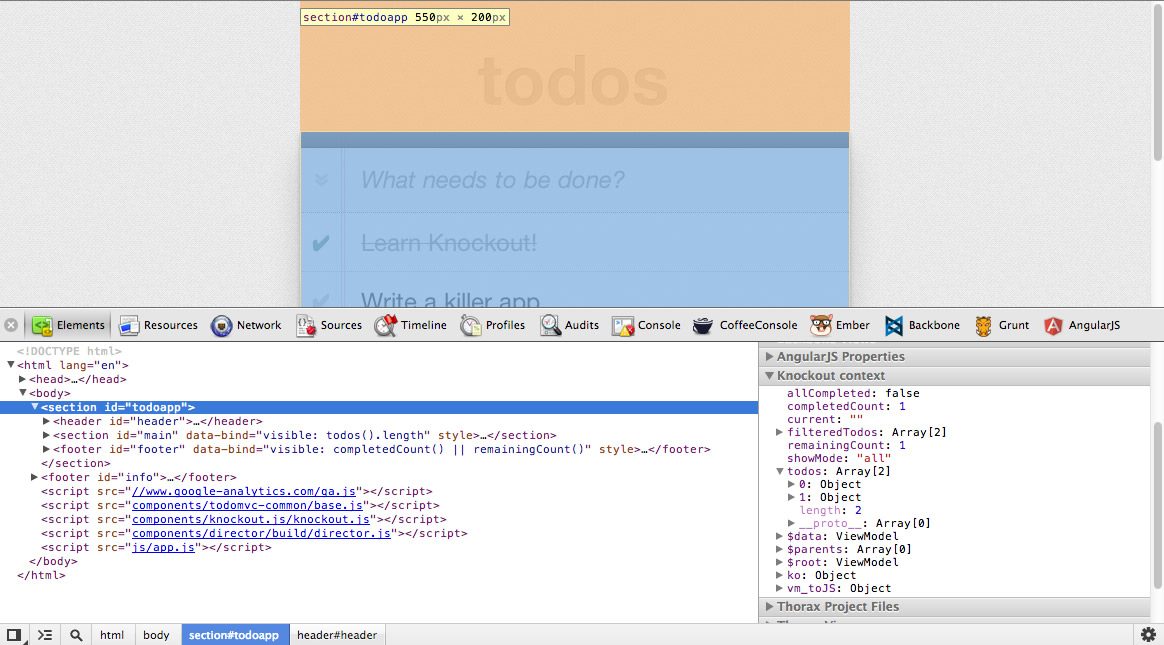
Inspect KnockoutJS context, data for any selected DOM node within the Elements panel. This is pretty useful if you're working on a complex app with many nested ViewModels.
- Released as a stable extension on GitHub
- Install via Chrome Web Store or
git clone git://github.com/timstuyckens/chromeextensions-knockoutjs.git
Rails Panel
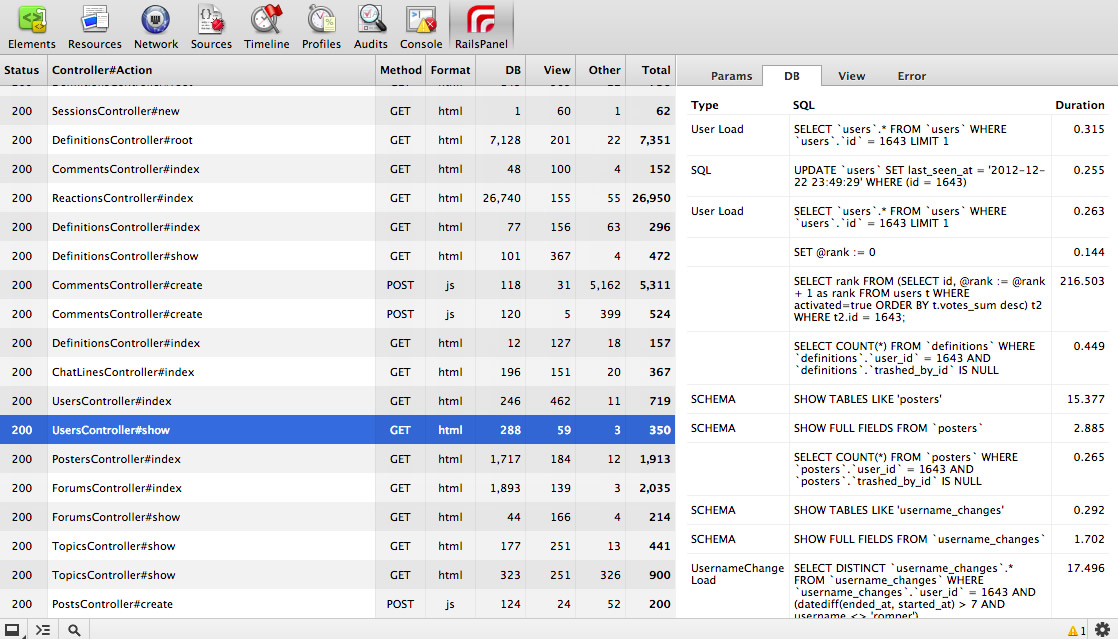
Stop tailing that Rails development.log with RailsPanel. Get insights into view rendering, DB, total request times and more. Note: in order to use this extension you need to add a set meta_request gem to your app's Gemfile. Checkout the readme for more info.
- Released as a stable extension on GitHub
- Install via Chrome Web Store or
git clone git://github.com/dejan/rails_panel.git
CoffeeScript Console
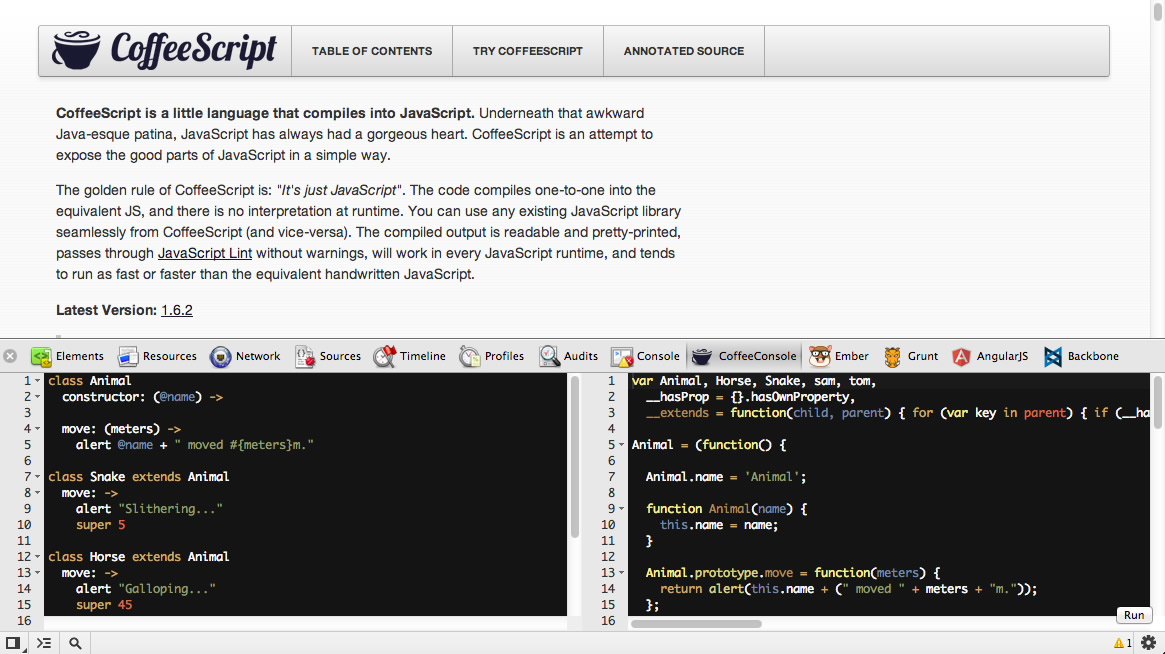
Whilst I don't regularly use CoffeeScript myself, I know a number of friends appreciate this extension. It exposes a console within the DevTools that live compiles CoffeeScript -> JavaScript and runs CS within the context of the current window.
- Released as a stable extension on GitHub
- Install via Chrome Web Store or
git clone git://github.com/snookca/CoffeeConsole.git - Screencast by Jonathan Snook
Grunt DevTools
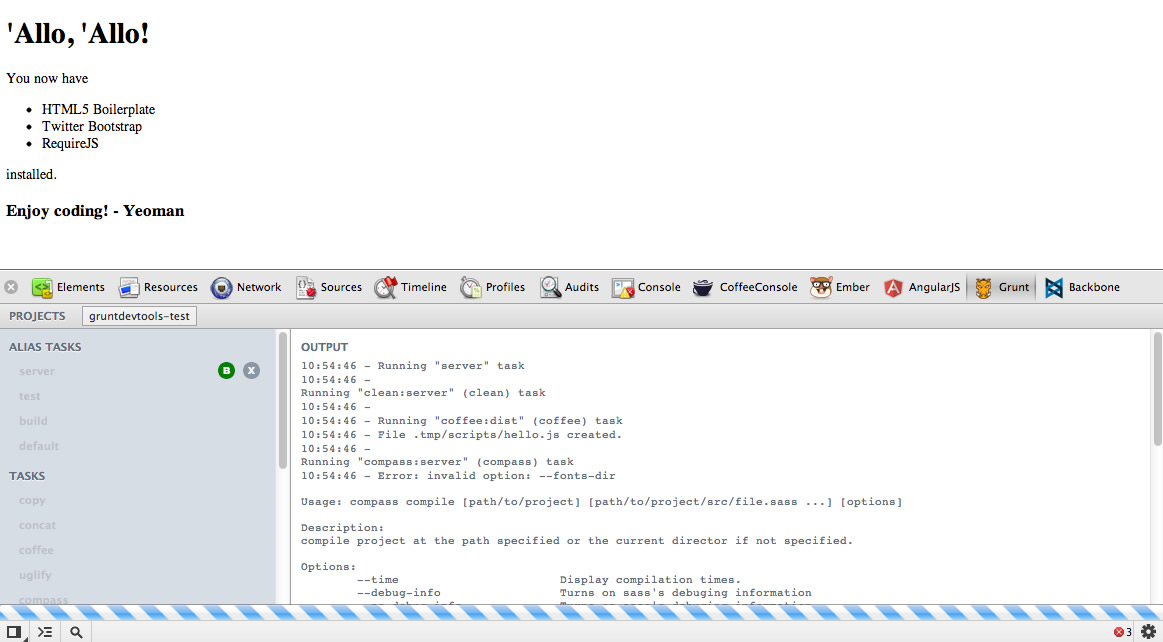
If you hate having to switch back and forth between your browser tools, the terminal and your editor you might appreciate this Grunt task runner extension for triggering Grunt tasks from the DevTools. It's really useful for quickly spinning up a LiveReload/server setup, linting, running tests or pretty much any tasks you have configured for a set Grunt project. Also works well with projects you've scaffolded using Yeoman.
- Released as a preview on GitHub
- Install via Chrome Web Store or
git clone git://github.com/vladikoff/grunt-devtools.git
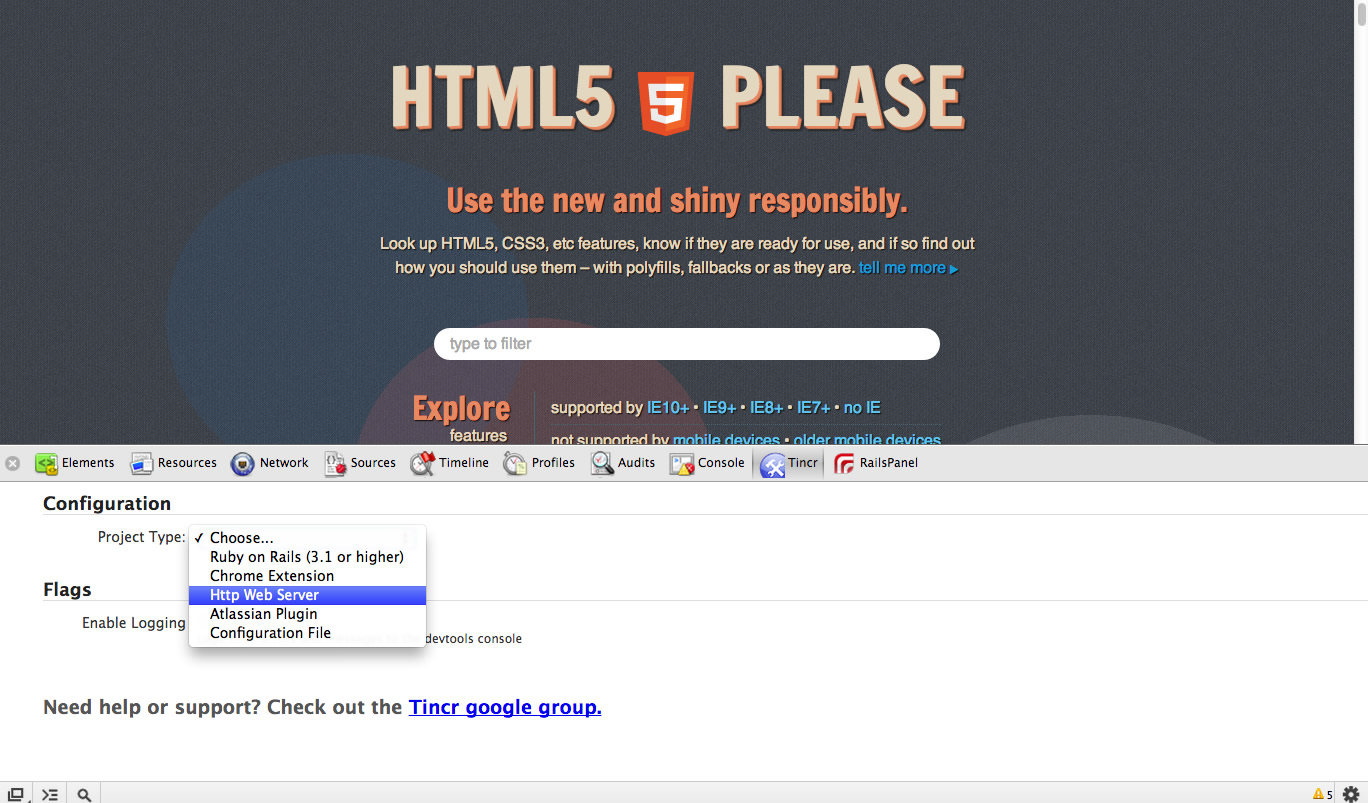
Tincr
The DevTools now make it easy to save directly back to your source files from the Sources editor. Tincr however supports bi-directional editing meaning if you save changes to a page from an external code editor, your page will be reloaded in Chrome without any manual effort on your part.
- Install from Chrome Web Store or get from BitBucket
- Screencast by Ryan Ackley
And More
There are simply too many workflow helpers to mention here, but for anyone interested, I also use:
- JSRuntime for easily grepping JavaScript objects from the Elements panel
- PrettyPrint for unminifying/prettifying both your JavaScript and CSS automatically when using view-source
- LiveReload which integrates well with the official LiveReload tool (make changes to your JS/CS/Sass/markup, automatic reload. Boom)
- CSS-Shack which lets you create sexy prototypes that export to CSS using a convenient GUI editor
- JetBrains Chrome Extension which gives you the ability to live edit in your editor and see real-time changes in Chrome when used with WebStorm IDE
If you're not already using these, I hope you find them useful!.
